
- Navigator
- Featured Indicator
- Prospecting and Business Attraction
The US Bureau of Economic Analysis (BEA) tracks information related to foreign direct investment (FDI) in the United States in terms of US affiliates of foreign companies. The BEA conducts mandatory surveys of US affiliates of foreign multinational enterprises to collect data needed to analyze the characteristics, performance, and economic impact of these firms.
Data related to the financial structure and operations of US affiliates of foreign parents is available on the BEA’s website.
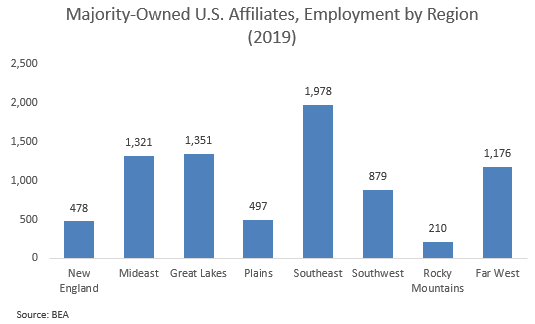
A variety of data is available, including FDI activity by industry and state. As of 2019, the most recent year for which data is available, US affiliates of foreign multinational enterprises had over $15.3 trillion in total assets and over 7.9 million total employees. This is a 33% increase in total assets and a 50% increase in total employees since 2009, indicating that employment at these firms is growing at a faster rate than total assets.
At the regional level, employment in US affiliates of foreign multinational enterprises is concentrated in the southeast with Florida, Georgia, and North Carolina accounting for the highest portions of total employment.
By industry, manufacturing accounts for the highest number of jobs nationally, at 36%. Retail trade is also a driver of employment at 12%. This is followed by wholesale trade (9%), professional, scientific, and technical services (6%), finance and insurance (5%), information (4%), and real estate (1%). The remainder (27%) is in other industries.
Regionally, finance and insurance is particularly prevalent in the mideast, real estate in the southeast, and information in the far west of the country.


Understanding trends in foreign direct investment is important to economic developers because it brings many economic benefits to the region and community within which it occurs.
FDI increases the creation of capital within a community, thereby improving local supply chains, productivity, and increasing multiplier impacts. This article provides just a brief snapshot of the FDI data that is available through the BEA.
For more information, please visit the BEA website.
Image Source: Adobe Spark and Camoin Associates

Real Estate Development and Housing
In 2025, the City of Albany, NY, partnered with Camoin Associates to complete a citywide housing audit that offers lessons for other mid-sized, moderate-growth cities about how to align housing policy with local economic realities while advancing equitable outcomes.

Industry Analytics and Strategy

Entrepreneurship and Innovation
Your resource for understanding today and looking toward tomorrow