Technology Solutions >
Data Dashboards
Information Driven Interactive Design
Information overload is real, but it doesn’t have to be. Using a cutting-edge data platform, our team can customize comprehensive, easy-to-use economic data dashboards that illuminate even the most complex datasets for economic, market, and impact analyses.
Our data dashboards have been designed for internal tracking of key economic indicators and performance metrics by decision makers and staff, and can also be seamlessly posted on your website to help you illustrate your impact.
We work to understand the most important data points, the critical analysis, and the most meaningful way to display it all so that our clients get the information they need quickly. The data is regularly refreshed, meaning you are not using yesterday’s data to make decisions for tomorrow.

Ways to Use Data Dashboards:
- Website monitoring for lead generation
- Real estate market trends
- Economic and demographic data
- Public reporting on economic development efforts
- Real time monitoring of strategic plan implementation
Featured Project: Nassau County (NY) Industrial
Development Agency Economic Impact Dashboard
Click the double arrow in lower right corner to view full screen.
Get Started
Want to learn more about data dashboards?

Contact Rachel Selsky, CEO:
P 518-899-2608, Ext. 107
E rachel@camoinassociates.com
Services
-
Economic Development Strategic Planning


Economic Development Strategic Planning
Whether you’re developing a statewide, regional, or local strategic plan, Camoin Associates works with clients to set a vision and develop strategies that will support ambitious, but achievable, goals.
+ Comprehensive Economic Development Strategies (CEDS)
+ Downtown revitalization plans
+ Economic development strategic plans
+ Evaluation and benchmarking
+ Strategic visioning
-
Workforce Development and Talent Retention


Workforce Development and Talent Retention
Camoin Associates can help you craft actionable workforce development and talent retention solutions to create a resilient labor pipeline, supporting equitable and inclusive economic growth.
+ Labor market analytics
+ Occupation and skills gap analysis
+ Career pathway mapping
+ Workforce pipeline development
+ Talent retention and attraction strategies
-
Real Estate Development Analytics and Advisory


Real Estate Development Analytics and Advisory
We help communities and developers do it all — from uncovering opportunities and developing project concepts to finding funding and navigating all the complexities from start to finish.
+ Housing needs assessments and housing strategies
+ Market analysis
+ Development strategies
+ Brownfield redevelopment
+ Developer advisory services
+ Financial feasibility analysis
-
Economic and Fiscal Impact Analysis

Economic and Fiscal Impact Analysis
To us, measuring the jobs, earnings, sales, and revenue is only the beginning. We take a holistic approach to economic and fiscal impact to tell the full story of what a project, industry, program, or development will do for the community.
+ Economic impact
+ Fiscal impact
+ Tax credit benefit/cost analysis
+ Tax Increment Financing (TIF)
+ District Improvement Financing (DIF)
-
Prospecting and Business Attraction


Prospecting and Business Attraction
As an established global research and direct marketing company, we have a track record of customizing and implementing high-end, mission-critical research and marketing campaigns that exceed client expectations.
+ Trade show appointment scheduling
+ Geographic marketing missions
+ Foreign direct investment (FDI) attraction
+ Site selector outreach
+ LinkedIn lead generation
+ ProspectEngage CRM
+ ProspectEngage Promote digital marketing
-
Industry Analytics and Strategy
Industry Analytics and Strategy
As leaders in research and data analysis, we use the most advanced and comprehensive economic data and tools to understand the supply chain, industry market trends, and sector needs, and unearth emerging opportunities.
+ Target industry and cluster analysis
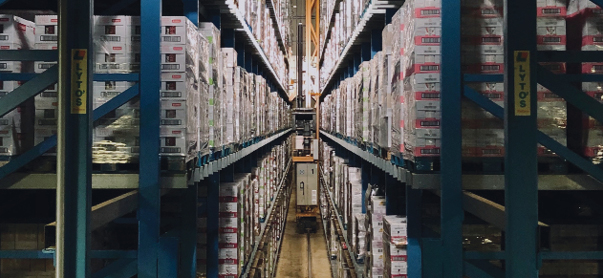
+ Supply chain and trade gap analysis
+ Geographic competitiveness analysis
+ Site selection needs analysis
-
Economic Resilience-Building


Economic Resilience-Building
Our work focuses on helping communities and regions understand where they are today and how to take practical steps to build stronger, adaptable economies for the future.
+ Resilience assessment and mapping
+ Adaptive foresight
+ Economic diversification
+ Data, indicators, and dashboards
+ Organizational capacity building
+ Implementation, funding, and impact support
-
Business Retention and Expansion

Business Retention and Expansion
Economic development is built on connections, and our custom business engagement solutions help you make those connections — from business retention to business expansion.
+ Business visitation process creation and set up
+ Logistical and technology support
+ Follow up plans and strategy development
-
Entrepreneurship and Innovation


Entrepreneurship and Innovation
We help clients identify, connect with, understand, and strengthen their entrepreneurial ecosystems. Our mission is simple: to build a more inclusive economy for the future by connecting and inspiring the entrepreneurs of today — and tomorrow.
+ Startup ecosystem assessment and action planning
+ Equitable entrepreneurship strategies: Breaking down barriers
+ Entrepreneurship metrics tracking and evaluation
+ Market research and intelligence
+ Small business outreach and resource centers
+ Policy and code assessment and outreach