
- Navigator
- Featured Indicator
- Industry Analytics and Strategy
 The US Bureau of Labor Statistics recently released a report on minimum wage workers that shows that the number of hourly workers paid at or below the prevailing federal minimum wage has declined 85% since 1979, shrinking from a high of 7.8 million workers in 1981 to just 1 million workers in 2022.
This occurred despite a 52% increase in hourly workers in the US, and a 150% increase in the federal minimum wage (which would also increase the number of individuals working at or below the minimum wage).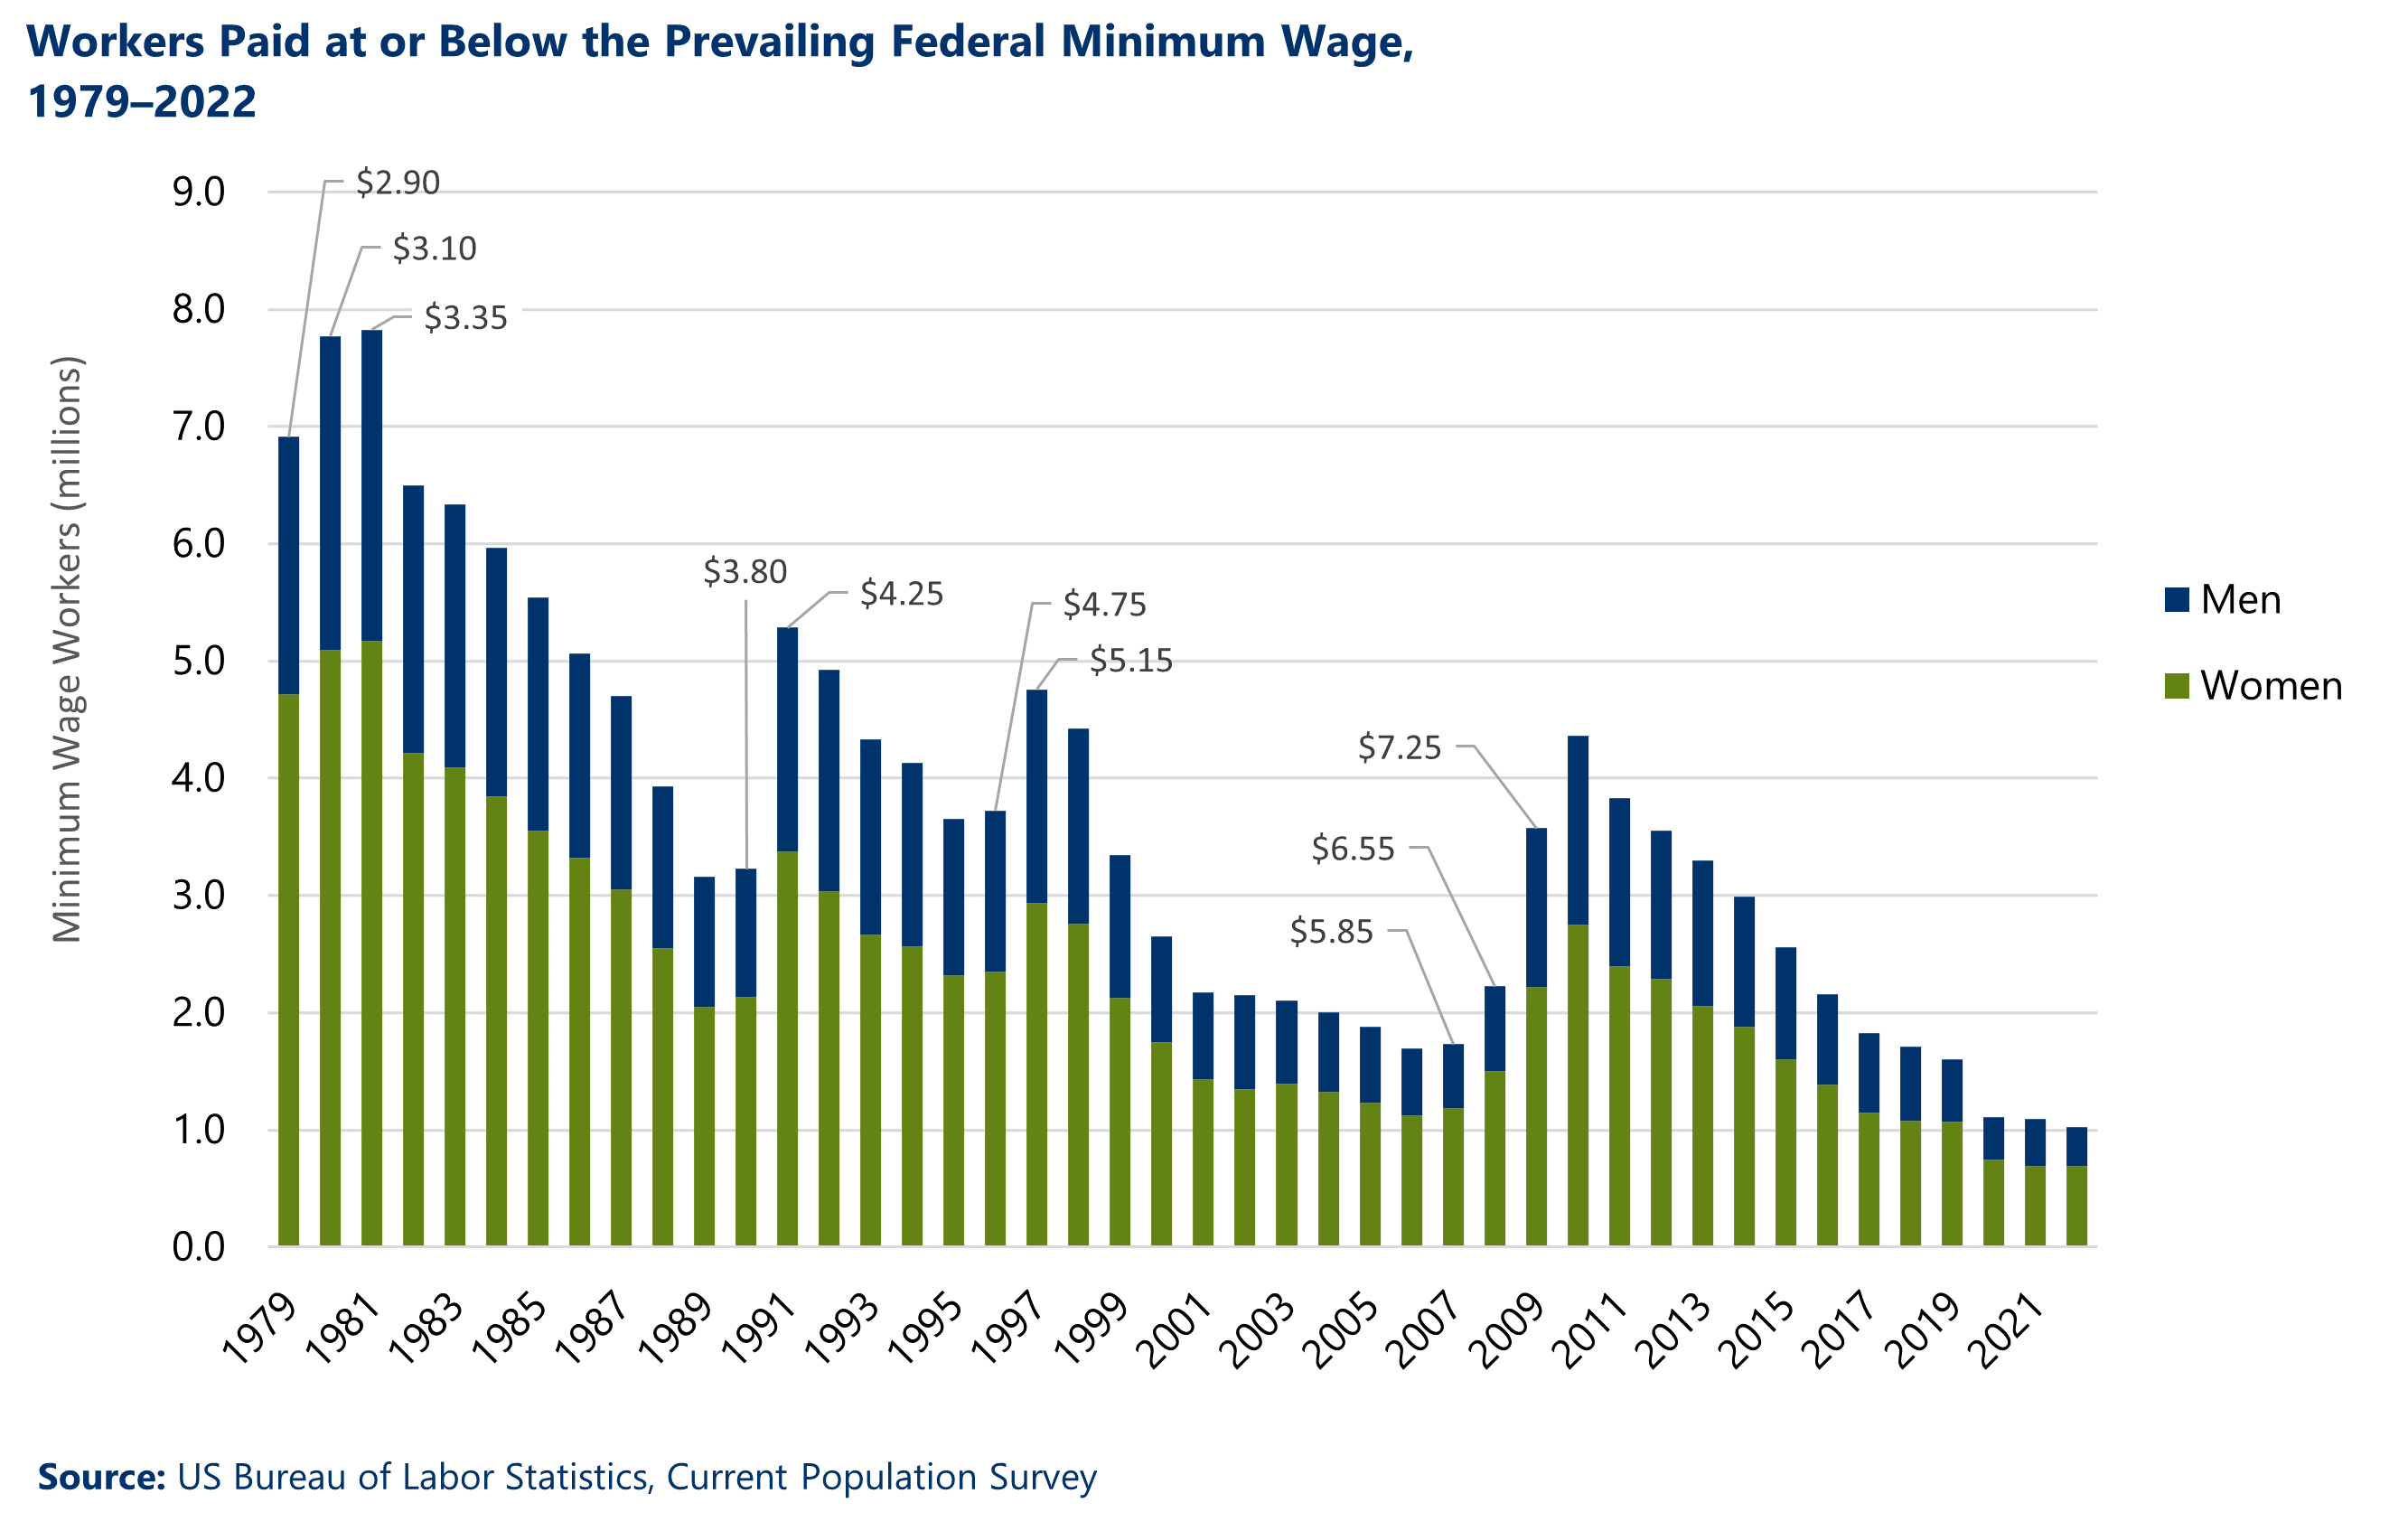
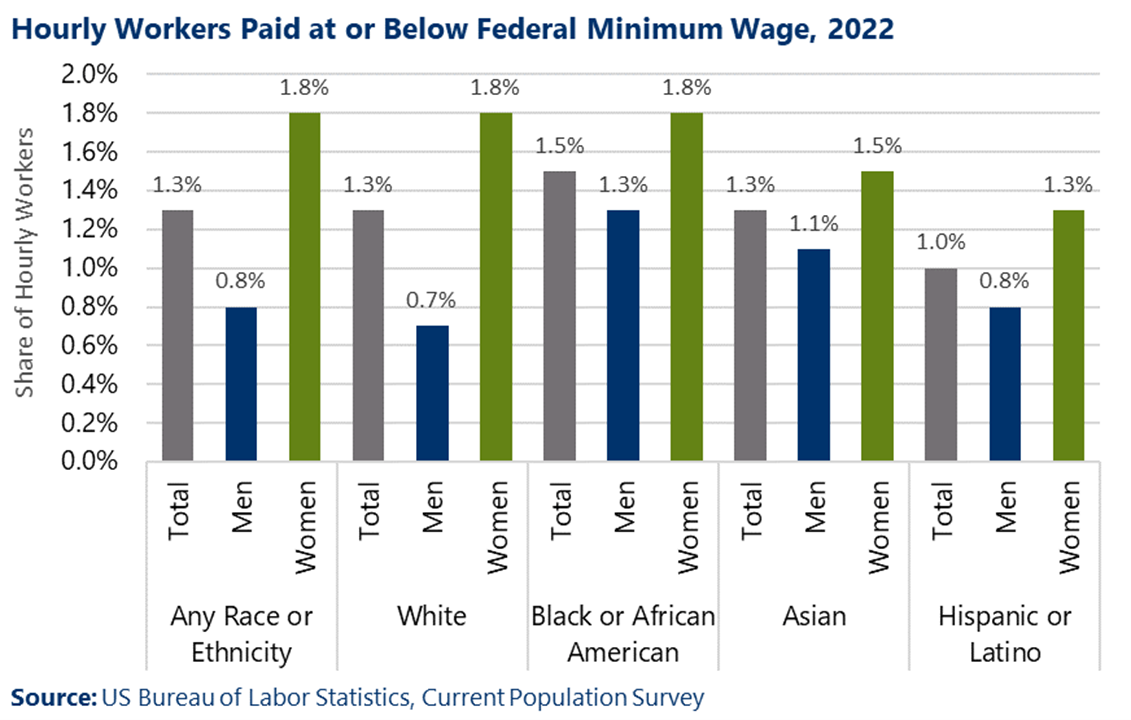
In 1979, 13.4% of all hourly workers earned minimum wage or less. As of 2022, the share had shrunk to just 1.3% of hourly workers.
Other key takeaways from the report include:
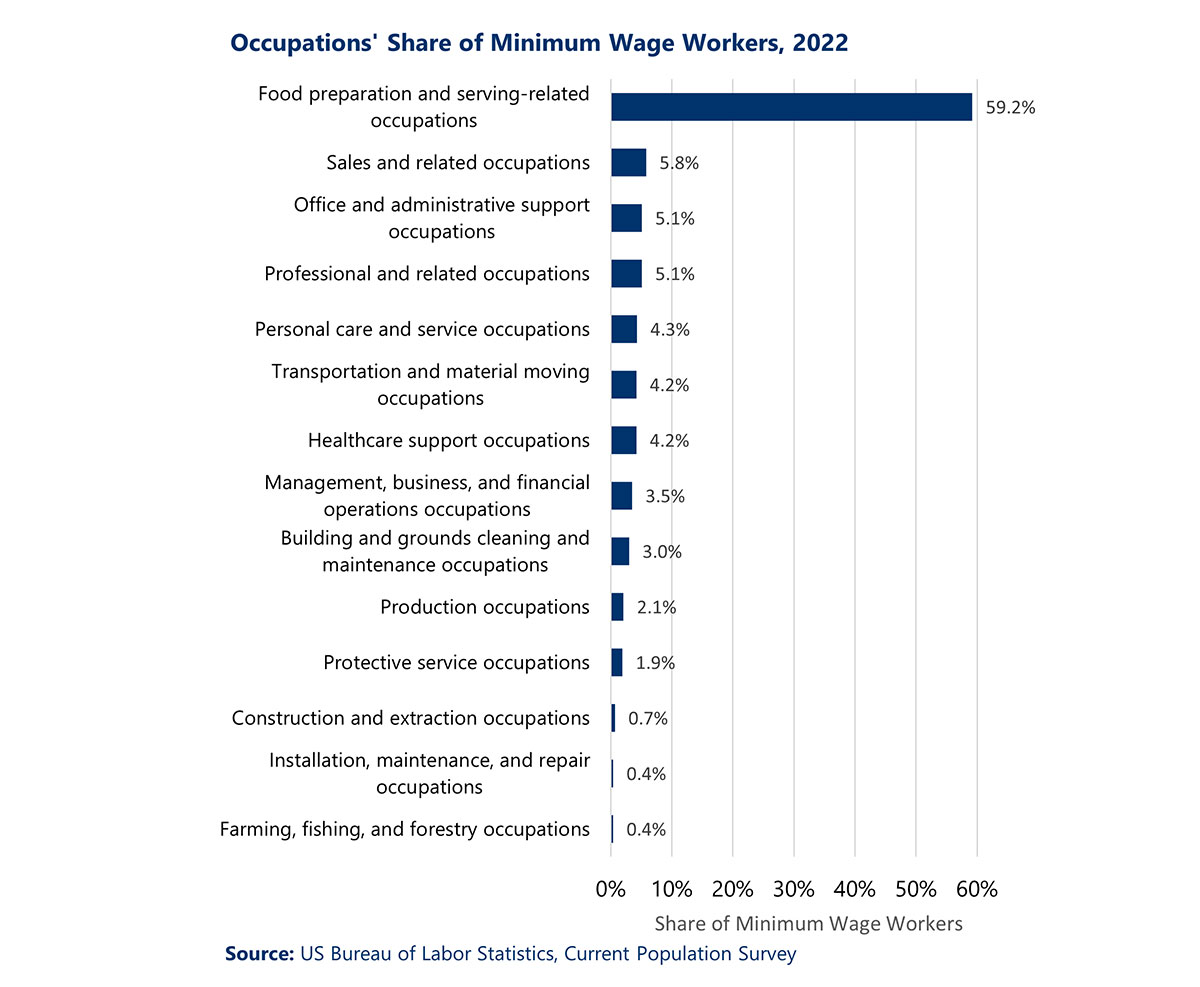
The data shows that most minimum wage workers are young, single, and without a college degree. These workers are just beginning their professional lives, possibly still in school or college, and these jobs likely do not represent long-term career choices. Gaining in-demand skills through education and training is one of the best ways to increase earnings.
The US Congress has increased the federal minimum wage only sporadically over the past 85 years, with the present $7.25/hour rate set in 2009. If the original minimum wage of 25¢/hour set in October 1938 had grown with inflation (as measured by the Consumer Price Index), it would be at $5.37/hour today. However, when Congress does raise the minimum wage, most of the time it is by much more than the amount of inflation since the last increase. Therefore, if the $2.90/hour minimum wage in 1979 had kept pace with inflation, it would be at $11.69/hour today. And if our current minimum wage had increased with inflation since it was set 14 years ago, it would be at $10.24/hour today.
Data in this report were compiled from the Current Population Survey (CPS), a monthly household survey conducted by the US Census Bureau. The CPS data covers only “wage and salary” workers and excludes the self-employed. Minimum wage numbers are calculated only for workers paid an hourly wage due to data quality concerns around calculating an equivalent hourly rate for salaried employees.
Camoin Associates is a national leader in using research and data analysis to help communities and organizations understand where they are now and develop actionable, equitable goals designed to get them where they want to be.

Business Retention and Expansion (BRE)
Learn how to launch your first agentic AI prospecting pilot in 60 days with our practical guide for economic development teams ready to move from AI curiosity to working agentic workflows covering trade show preparation, ongoing signal-based prospecting, and BR&E expansion signal monitoring.

Industry Analytics and Strategy

Real Estate Development and Housing
Your resource for understanding today and looking toward tomorrow