
- Navigator
- Expansion Solutions
- Construction and Utilities
- Industry Analytics and Strategy
Editor’s Note: This article was originally published in the November/December 2019 issue of Expansion Solutions Magazine.
Oil, gas, and coal have been drivers of the US economy from the beginning stages of the industrial economy and have continued through the transition to the high-tech, knowledge economy. They are also key parts of emerging industry trends impacting the economy of tomorrow. In this article, we examine the oil, gas, and coal industries and first provide an overview of key economic performance data and trends. We also examine how these three industries impact other industries through supply and value chains. We conclude with what all this means for economic and business developers, including for those within communities that do not have extraction-related or even process-related concentrations in these industries.
Oil, gas, and coal are significant to the economy on two fronts. On their own they create direct economic output. This includes direct jobs, sales, and exports. They also create impact by providing the resources to generate energy used by other industries, as well as an input to downstream markets including distributors, processors, and manufacturers. In the case of manufacturers, oil, gas, and coal are used for both energy and as an input to manufacturing of plastics, rubber, chemicals, as well as other products. This further contributes to job, sales and exports.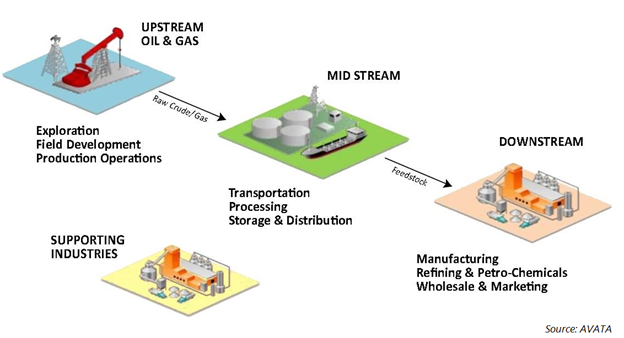
In 2018, the oil, gas and coal industries combined employed approximately 195,000 individuals throughout the United States, accounting for 0.12 percent of the total United States economy in terms of jobs. The industries accounted for approximately 8,200 of the 10.1 million businesses in the United States (0.08 percent). In terms of both jobs and Gross Regional Product (GRP), the crude petroleum extraction industry comprises the majority of the oil, gas, and coal sectors. The crude petroleum extraction industry constitutes nearly 106,000 jobs (54 percent of the total jobs in the oil, gas, and coal sector) and $141.3 billion in GRP (69 percent of the total GRP). Comparatively, the coal mining industry has approximately 51,000 jobs for 26 percent of all jobs and contributes $19.3 billion in GRP or ten percent of the total oil, gas, and coal GRP. Gas constitutes 20 percent of jobs and 21 percent of GRP.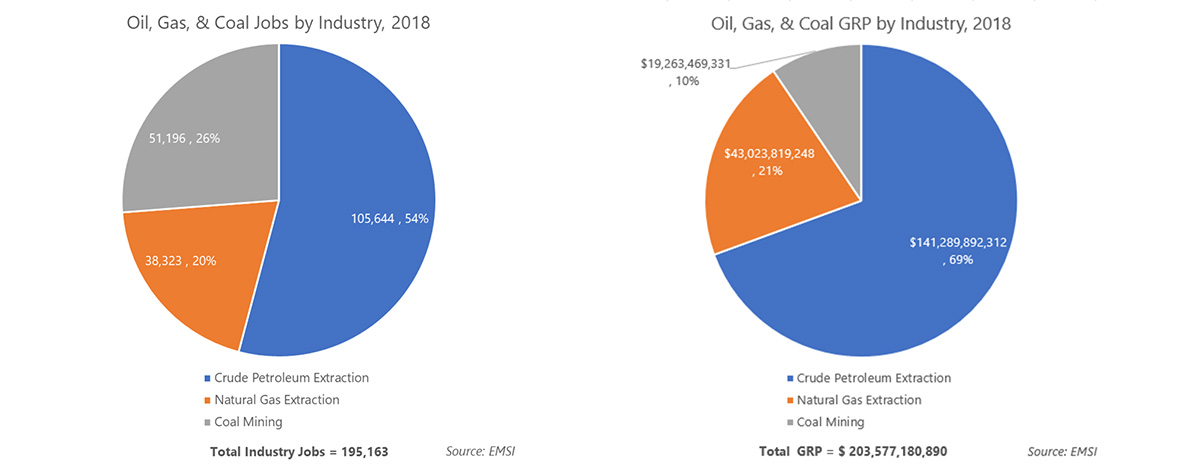
Between 2008 and 2018, all three industries in the oil, gas, and coal sector experienced job declines ranging from 6.7 percent – 37.0 percent which resulted in an overall decline of 20 percent for the combined industries. Comparatively, the United States economy overall grew by 7.6 percent during that time frame.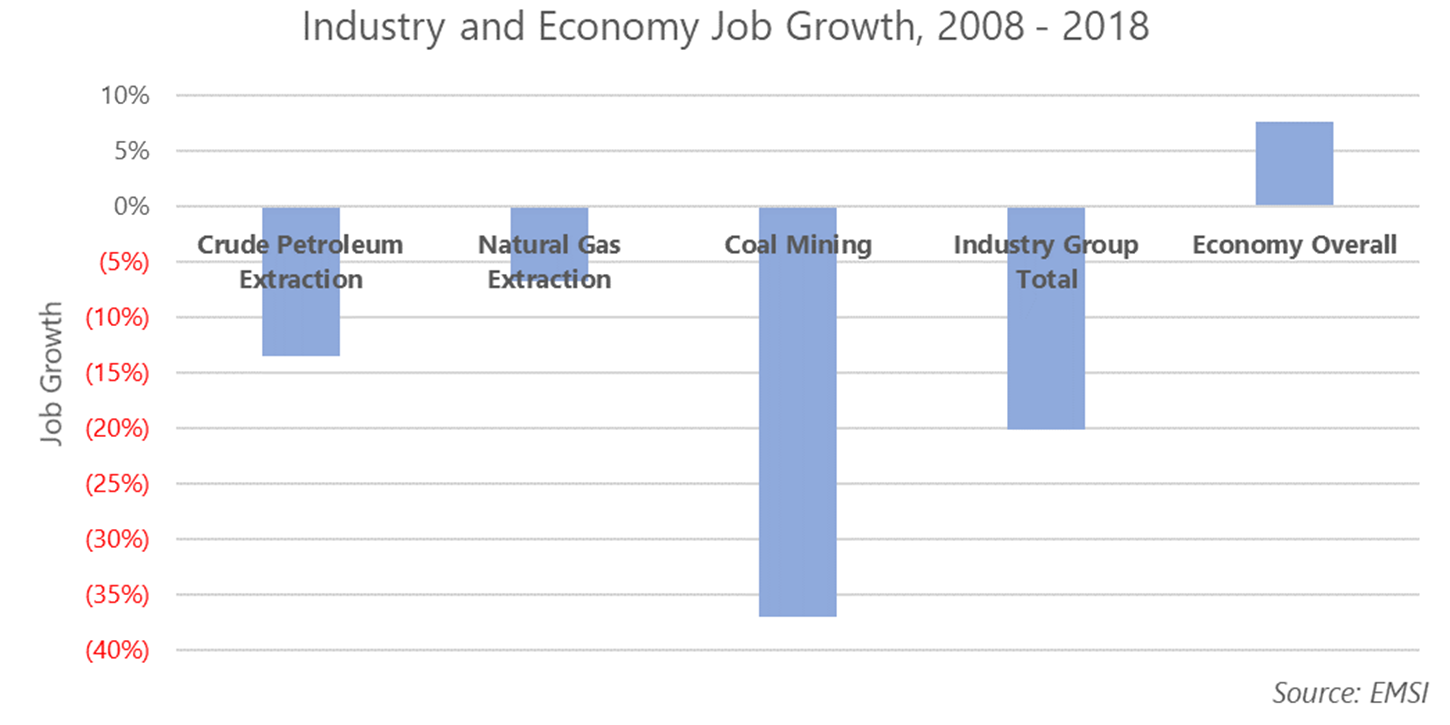
Historically, the oil, gas, and coal industries have experienced job fluctuations with sharp increases following 2010, then a sharp decline starting in 2012 until 2014. By 2016 to 2017, job growth in oil and gas reached its bottom and has since experienced slight increases, while losses in coal jobs continued. Looking ahead to 2028, oil and gas are projected to experience job increases while coal is projected to continue its decline.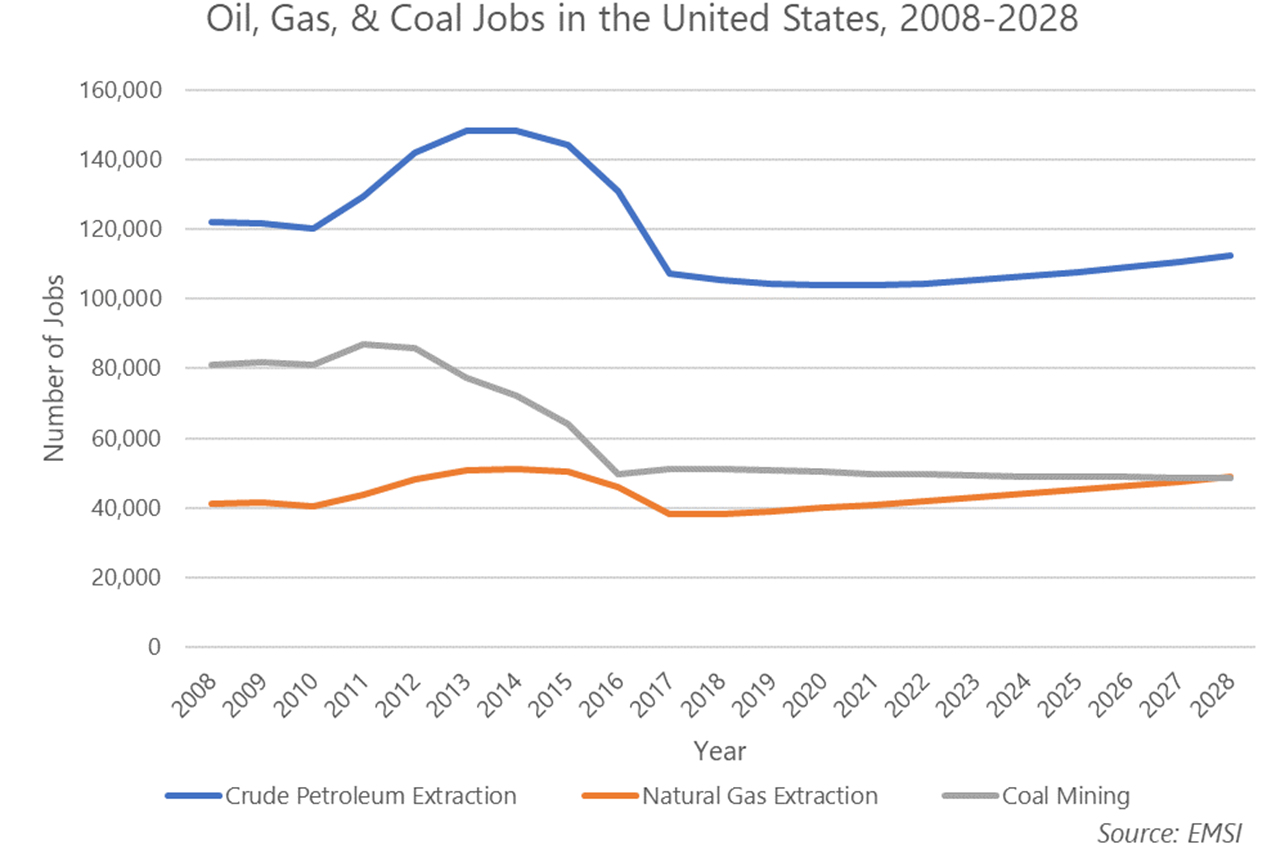
Earnings in the oil, gas, and coal sectors rank significantly higher than national average earnings. As of 2019, average national earnings were approximately $67,000 per job for the economy overall compared to $194,000 per job for the oil, gas and coal combined. Crude petroleum extraction (NAICS 21120) exhibits the highest average earnings at upwards of $226,000 per job.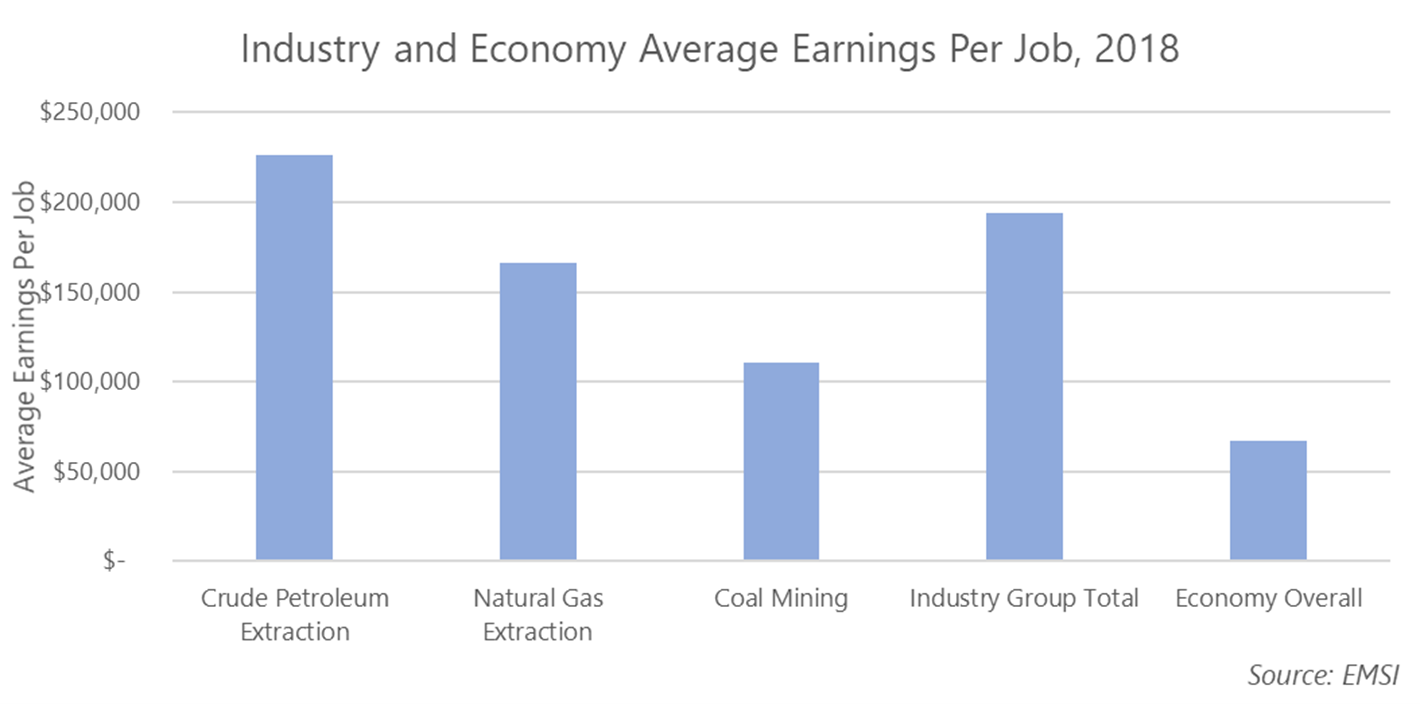
The maps below display the job concentrations in the United States by state for each of the industries that comprise the oil, gas and coal sector.
In all industries, Texas shows particularly high job concentrations.
Crude Petroleum Extraction (NAICS 21120) Job Concentration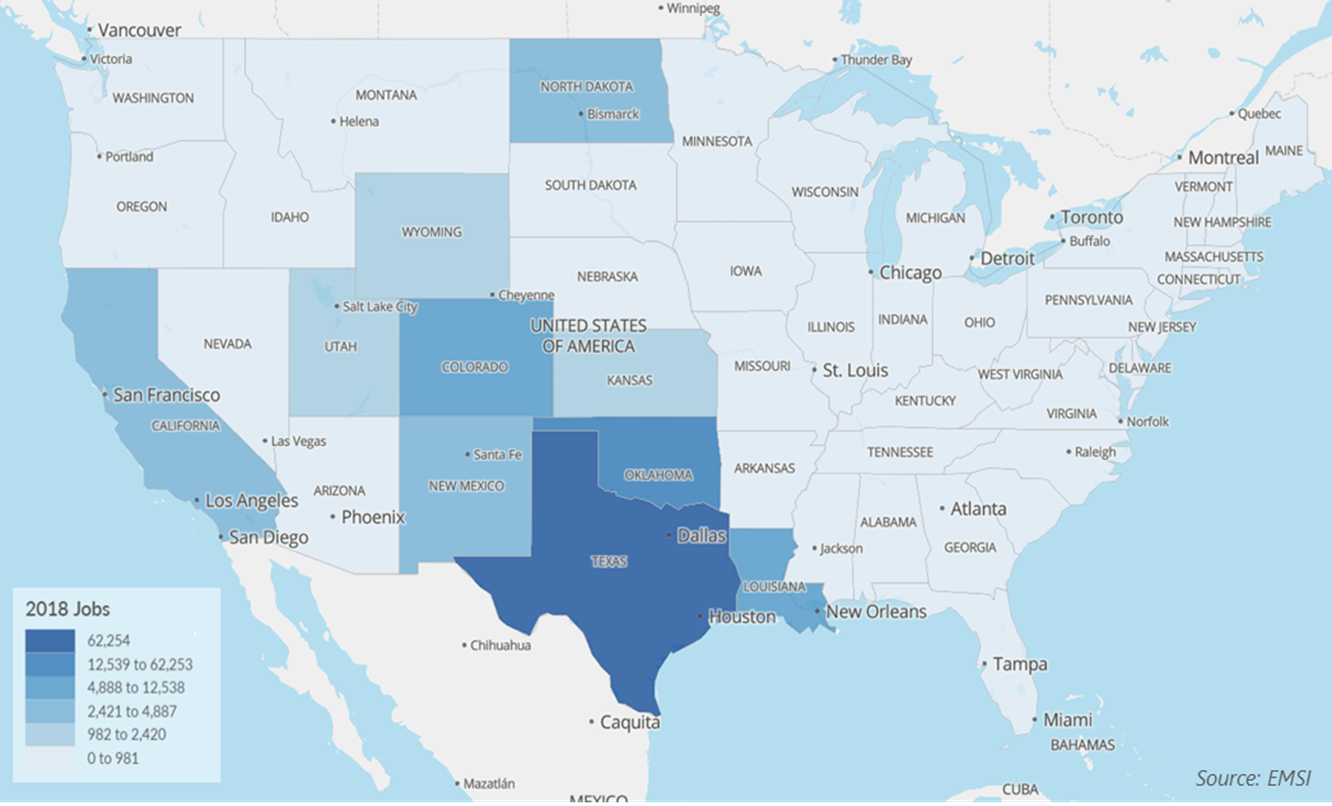
Natural Gas Extraction (NAICS 21130) Job Extraction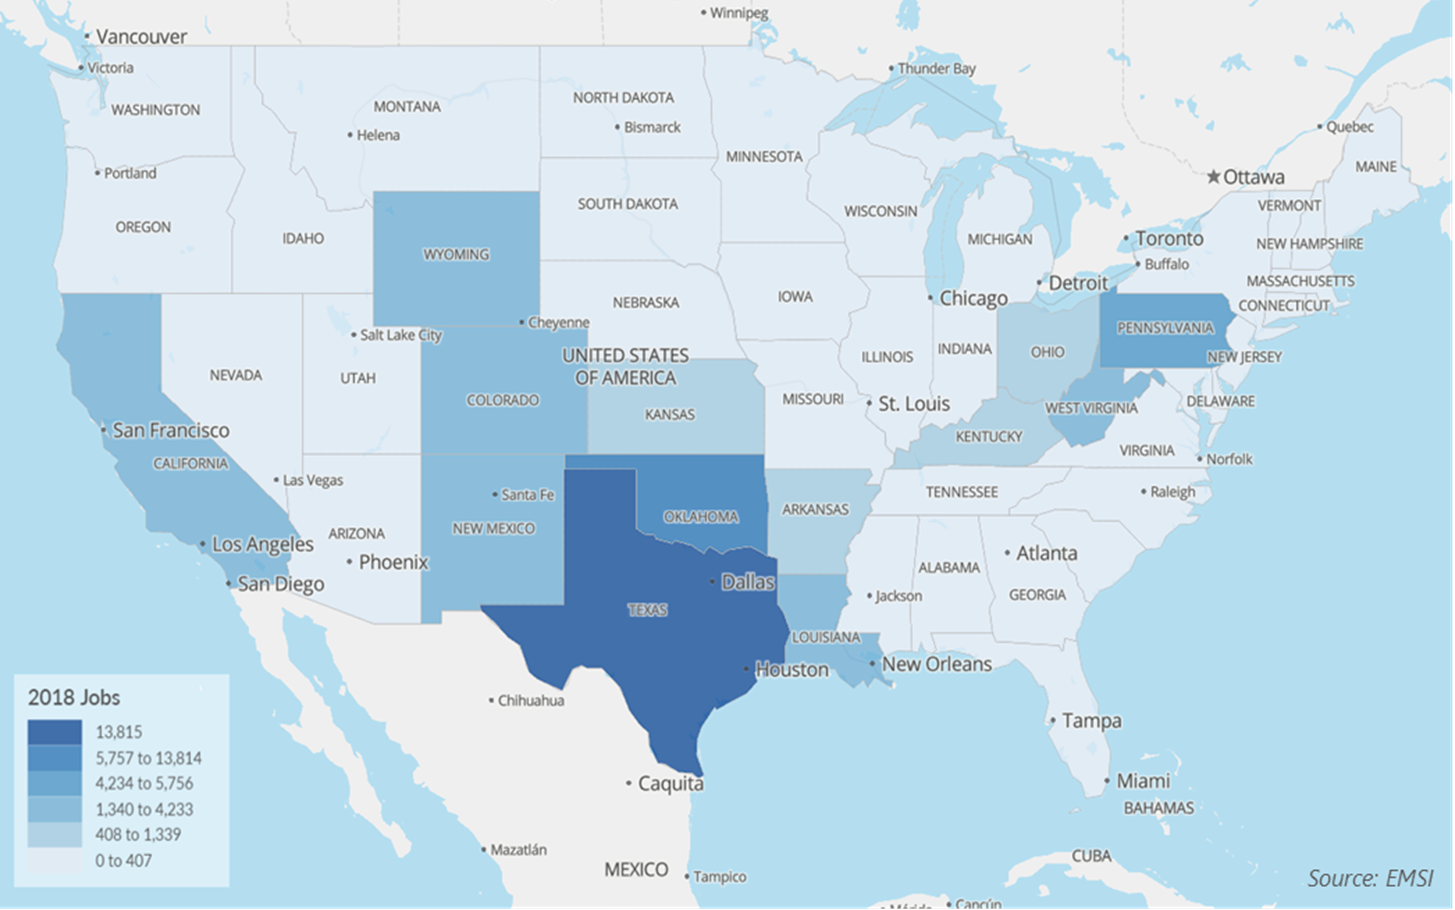
Coal Mining (NAICS 2121) Job Concentration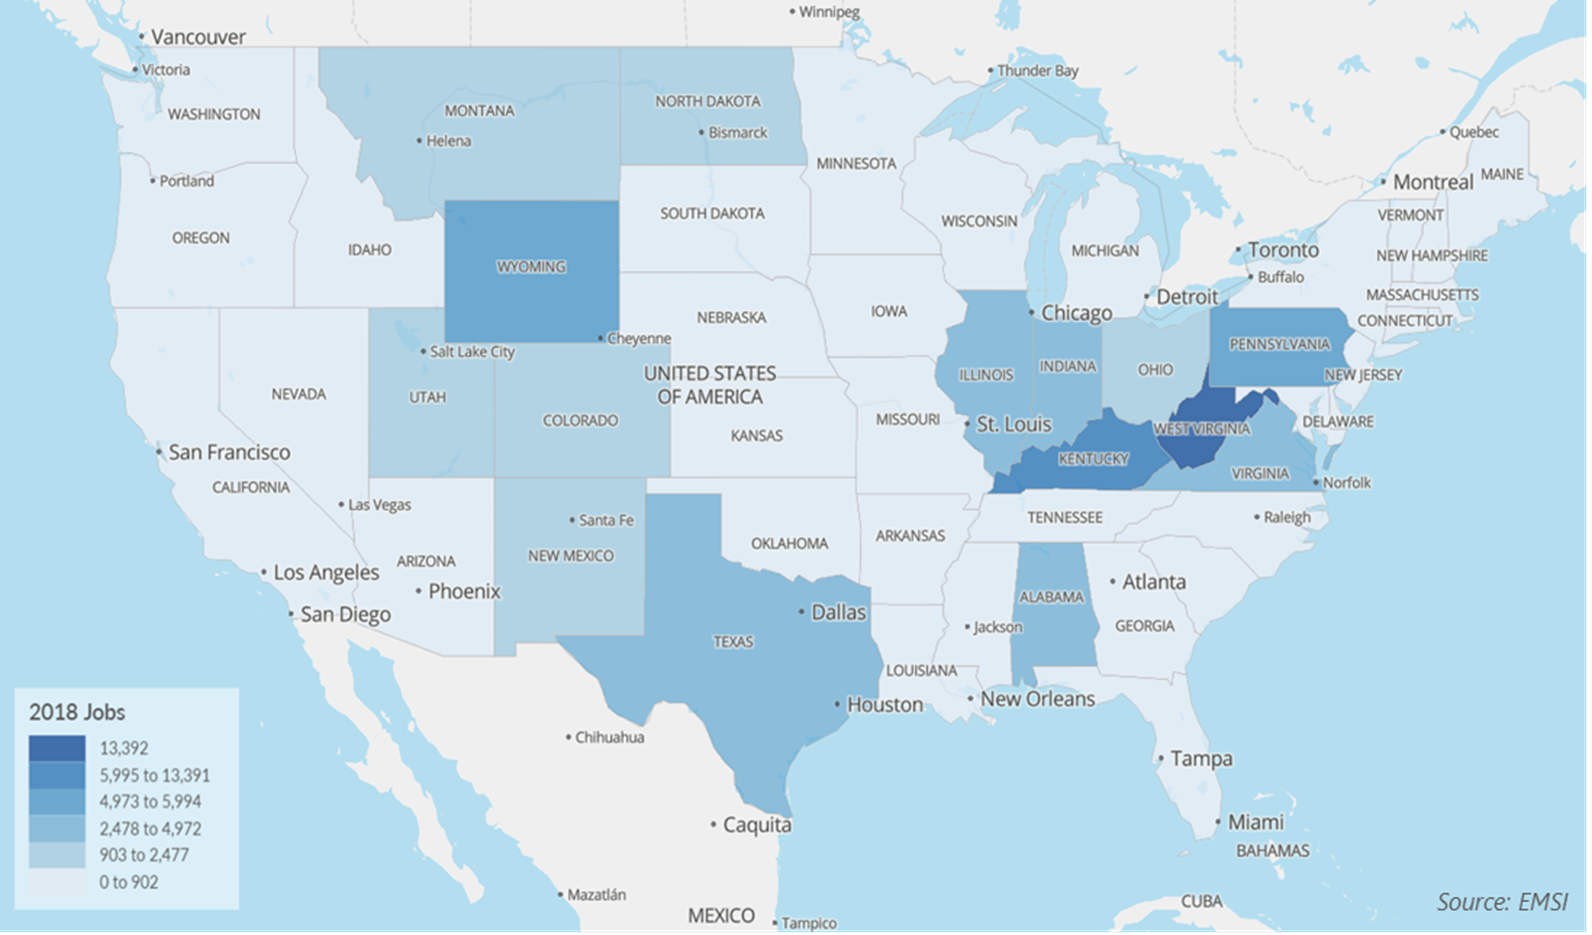
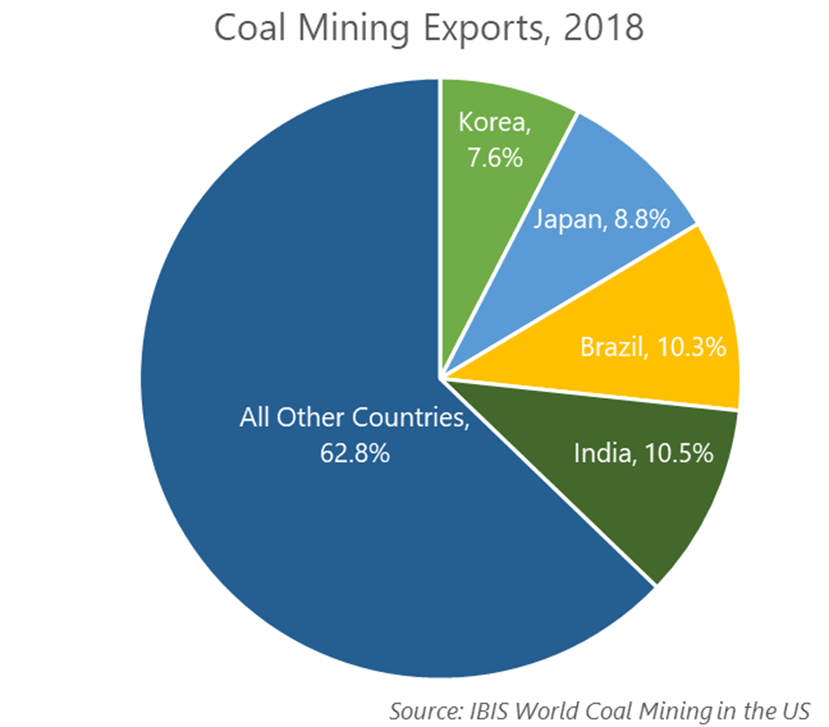
Looking at revenues and exports, IBIS World reports the coal mining industry had an annual revenue of $25.8 billion with exports totaling $10.0 million in 2018. Major coal mining export markets include India (10.5 percent of all exports), Brazil (10.3 percent), Japan (8.8 percent), and Korea (7.6 percent). While not detailed in the chart below there are substantial exports to European Union countries as well. The coal mining industry itself experienced a sharp decline between 2013 and 2018 at an annualized rate of 8.3 percent. Looking forward to 2023, the coal mining industry is expected to rebound at an annualized rate of 0.4 percent to $26.3 billion in revenues.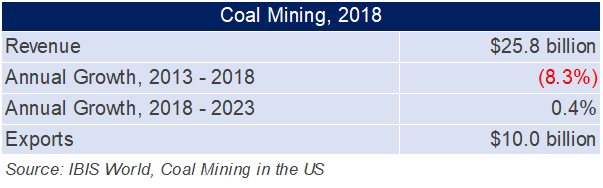
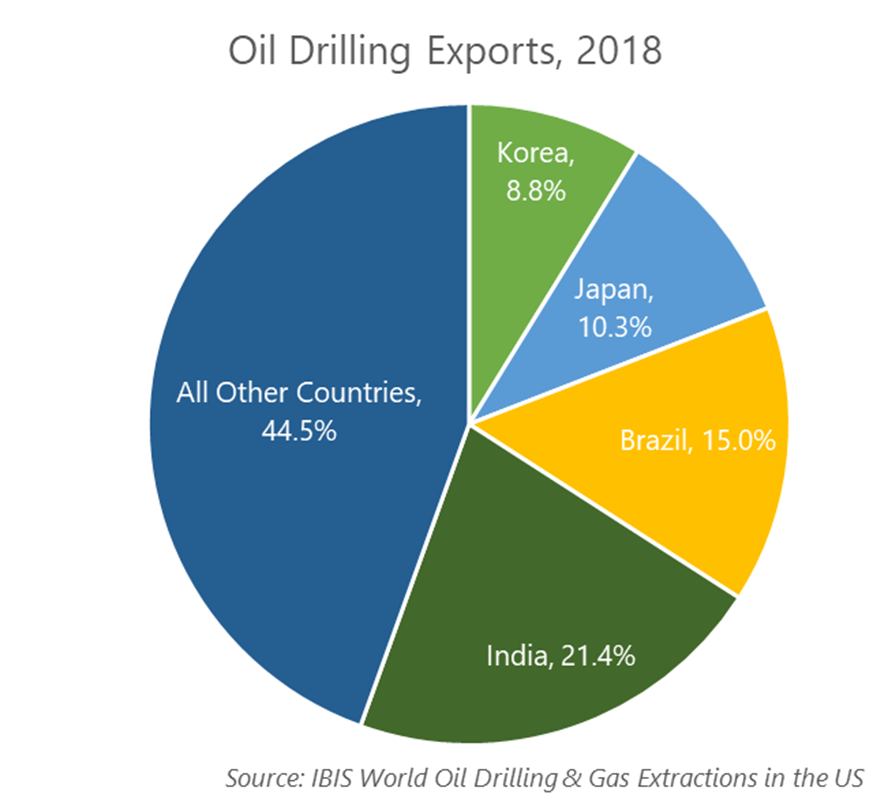
The oil drilling and gas extraction industry has significantly higher revenues at approximately $280.4 billion in 2018. Exports in this industry were estimated at $21.0 billion, primarily going to India (21.4 percent), Brazil (15.0 percent), Japan (10.3 percent), and Korea (8.8 percent). From 2013 to 2018, the industry declined at an annualized rate of 5.0 percent. The industry is expected to rebound at an annualized rate of 10.9 percent, reaching revenues of $469.4 billion by 2023.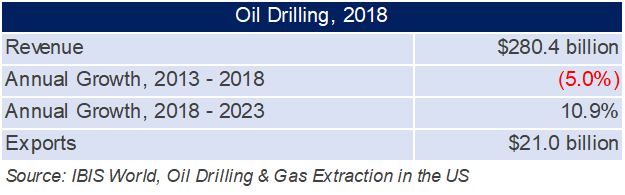
The oil, gas and coal industries can be very volatile and performance is tied to many global factors. Prices of coal, oil and natural gas as well as energy consumption are among the more obvious drivers. China’s GDP is a good indicator of demand in developing economies which rely on coal used in infrastructure development and electricity generation. Trade-weighted index measures the strength of the United States dollar, as the strength increases domestic good are more expensive and thus can reduce demand for U.S. oil, gas and coal products.
Source: IBIS World, Coal Mining in the US and Oil Drilling and Gas Extraction in the US
Energy: Oil, gas, and coal combined remain as major sources of feedstock for electricity generation in the United States, in particular, coal and gas. They are therefore critical to all industries. In 2018, oil, gas, and coal accounted for 63 percent of electricity generation with gas accounting for 35 percent, coal 27 percent, and petroleum (oil) one percent. In the past decade we have experienced a decline in coal as an energy source with increases in gas and renewables1.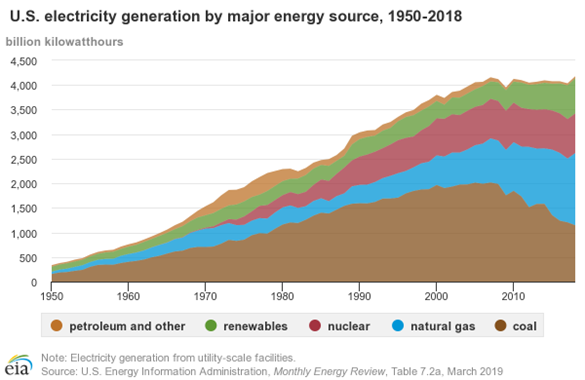
Manufacturing: Oil, gas and coal downstream industries process, purify, store and distribute the extracted product (midstream industries). Product further gets refined, converted and transported to downstream industries and utilized for energy and manufacturing. For downstream manufacturers, oil and gas in particular are utilized as an input to value-added production. Examining, the sales to manufacturing industries compared to sales to all other industries show that 16 percent or $10.4 billion of the sales are attributed to manufacturing industries while the remaining $55.7 billion (84 percent) are involved in all other oil, gas, and coal sales (excluding refineries).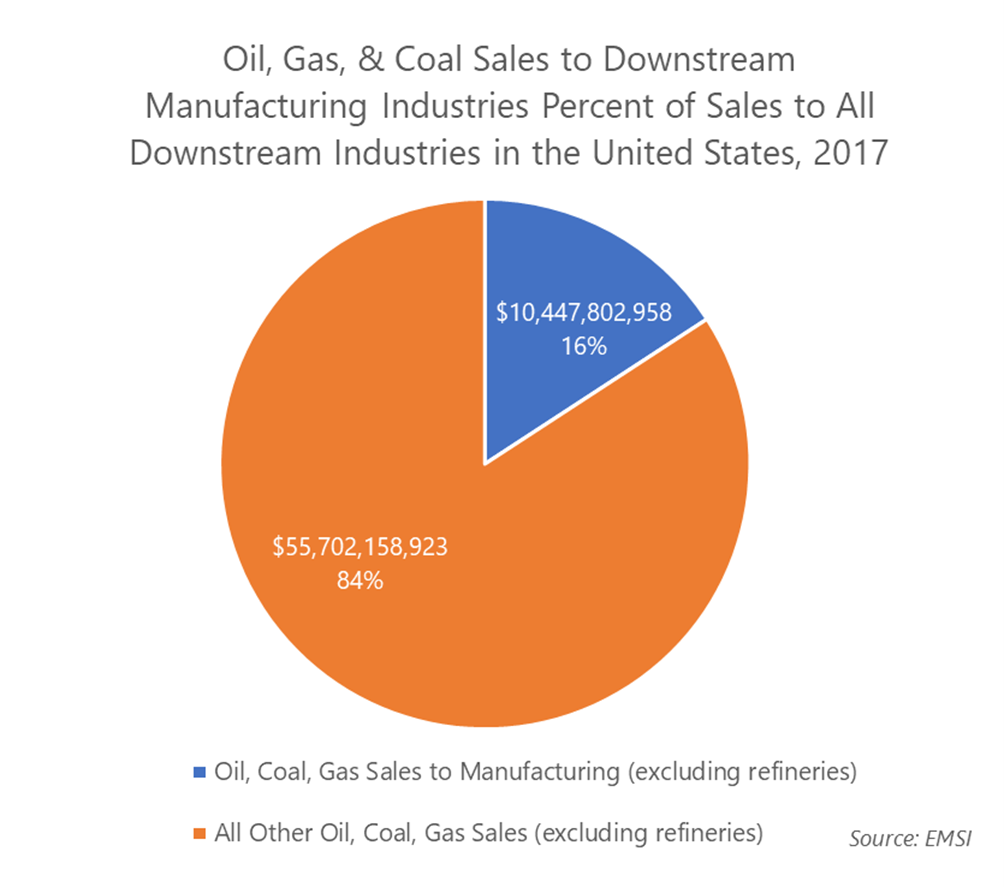
The table below details the top twenty downstream manufacturing industries by their total dollar value of in-region purchases. These industries represent use the oil, gas and coal purchased from the United States and display a diverse use of resources.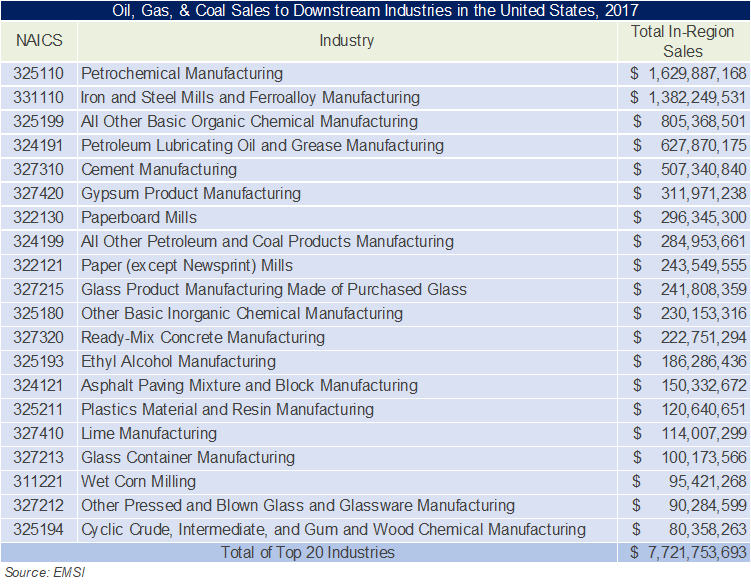
As established in this article, oil, gas and coal play critical roles in the U.S. economy both directly as sources of employment, output, and exports and as critical components to supply and value chains in other industry sectors including as a source of energy and inputs in manufacturing. Whether your region or state has upstream oil, gas and coal resources and activity through extraction, processing, or distributing, or whether your manufacturing base is reliant on them as an input for electricity and production, it is important to track these critical industries. Their performance is impacted by many factors, which in turn impact downstream industries. These factors include competition from other energy and manufacturing input sources such as renewables for energy, and bio-based input for manufacturing as well as competition from imports from other countries including Canada, Venezuela, Mexico, Columbia, and Saudi Arabia. Globalization, international trade, and the geo-political environment significantly impact both supply and demand of oil, gas and coal. Finally, regulation is also a critical factor impacting the industries as they are highly regulated at the federal, state and local levels from production to environmental regulations.
Sources: [1] U.S. Energy Information Administration, www.eia.gov/energyexplained/electricity/electricity-in-the-us.php
Image Source: Expansion Solutions

Real Estate Development and Housing
The US has a housing gap of 4-7 million homes. Could intergenerational living and boarding houses, once common practices in our history, be relevant again?

Industry Analytics and Strategy

Marketing and Communications
Your resource for understanding today and looking toward tomorrow