- Navigator
- Featured Indicator
- Evaluation and Benchmarking
- Regional
- State
- National
The Hachman Index – A Measure of Economic Resiliency
COVID-19 has brought a renewed focus on resiliency at the national, regional, state, and local levels. While the pandemic has impacted the entire economy, certain industries and occupations (like hospitality) have been disproportionately affected. Imbalances in a region’s economy are one of many contributing factors to the impact felt by an economic shock, such as COVID-19.
Economic diversification is important to resiliency in that is improves a region’s ability to bounce back after a shock, recover to a former state, and structurally adapt for the better.[1] Generally, regions with more diverse industry structures fare better during times of national or local employment shocks.[2]
The Hachman Index, a measure of economic diversity, is one way to assess a region’s economic resiliency. Developed by Frank Hachman and first published by the University of Utah’s Bureau of Business and Economic Research in 1994, the index measures the mix of industries present in a particular region relative to a reference region. Index scores range from 0-1.0 (or, 0-100, depending on the source), with a higher score indicating greater economic diversity and a lower score indicating less economic diversity.[3]
What is the data telling us?
The Hachman Index can be calculated for any region. It is the inverse of the mean location quotient for a region, with weights equal to each industry’s employment or GDP share. Where location quotient looks at the concentration of a specific industry, the Hachman Index aggregates this information in an assessment of overall regional diversity. An index value of 1.0 indicates that a regional industry mix is identical to that of the reference area as a whole (usually, the U.S.). Values closer to 0.0 indicate extreme specialization in a region.
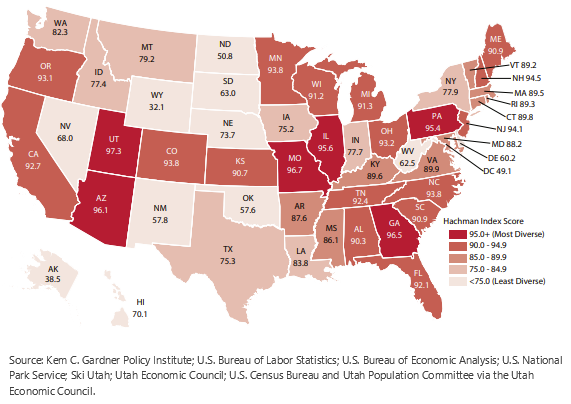
According to a 2021 report prepared by the Utah Economic Council[4] in which the Hachman Index was calculated for all 50 states, Utah, Georgia, Missouri, Arizona, and Illinois are the most economically diverse while Wyoming, Alaska, and North Dakota are the least economically diverse, based on GDP.

Why is this important?
Understanding your region’s level of economic diversity is an important piece of the resiliency puzzle. Regions with strong economic diversity face some protection from economic disruption, particularly disruptions that disproportionately affect a small number of industries.
[1] Economic Diversification, Resilience, and the Path to Inclusive Growth. NYCEDC Economic Development Quarterly, Nov. 2019.
[2] Brown, L. and Greenbaum, R.T. The Role of Industrial Diversity in Economic Resilience: An Empirical Examination Across 35 Years. Urban Studies, Jan. 2016.
[3] Benway, DJ. Measuring Economic Diversity: The Hachman Index, 2017. Kem C. Gardner Policy Institute. Feb. 2019.
[4] 2021 Economic Report to the Governor Highlights. Utah Economic Council.
Image Source: Adobe Spark and Camoin Associates


