
- Navigator
- Featured Indicator
- Industry Analytics and Strategy
 Data is everywhere these days. COVID-19, STEM, website metrics, data-driven policy, and the digitization of just about everything means that we’re flooded with a continuous and often overwhelming stream of measures, metrics, and indicators. One approach to channeling the flood is to combine multiple measures into a single data index.
Think of the Consumer Price Index (CPI), for example, a measure of inflation on many minds lately. As the US Bureau of Labor Statistics (BLS) describes it, “The CPI represents all goods and services purchased for consumption by the reference population. BLS has classified all expenditure items into more than 200 categories, arranged into eight major groups.”
So, rather than tracking changes in the individual prices of hundreds of items and then trying to figure out what it all means for the economy, it’s distilled into one or two simple numbers.[1] Changes in the CPI are then used as an indicator of the condition of the overall economy, how well-off people are, and what potential actions the federal government might be considering, among other things.
At Camoin Associates, we’ve developed a couple of indexes to provide regions with insights into their potential for prosperity and their competitiveness relative to other regions. These indexes combine several metrics into a single score that can be used to compare geographies.
Our Geographic Competitiveness Index, for example, combines up to 16 measures across eight categories for 385 metropolitan statistical areas (MSA) into a single score for each MSA. The measures are based on factors that businesses consider essential or important in the site selection process and are tailored to the specific industry or cluster under consideration.
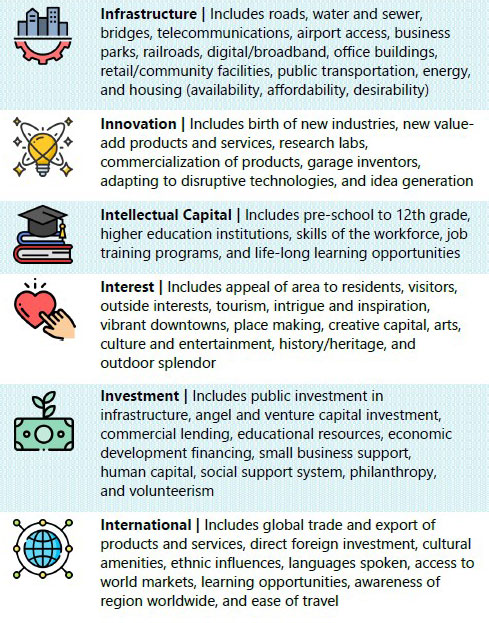
Similarly, Camoin Associates developed an index that ranks regions on the 6 I’s of economic prosperity, a framework developed by our Senior Vice President Dan Gundersen, FM, HLM, when he served as Commissioner of Economic Development for New York State. The 6 I’s are Infrastructure, Innovation, Intellectual Capital, Interest, International, and Investment, and the index combines 25 indicators in the six categories for all 50 states and the District of Columbia.
Video: Dan Gundersen Explains the 6 I’s of Economic Prosperity
We recently used our 6-I index to help the State of Utah assess its competitive position as part of its strategic planning process and are currently using it to develop Rhode Island’s long-term economic strategy.
6-I Ranking of US States
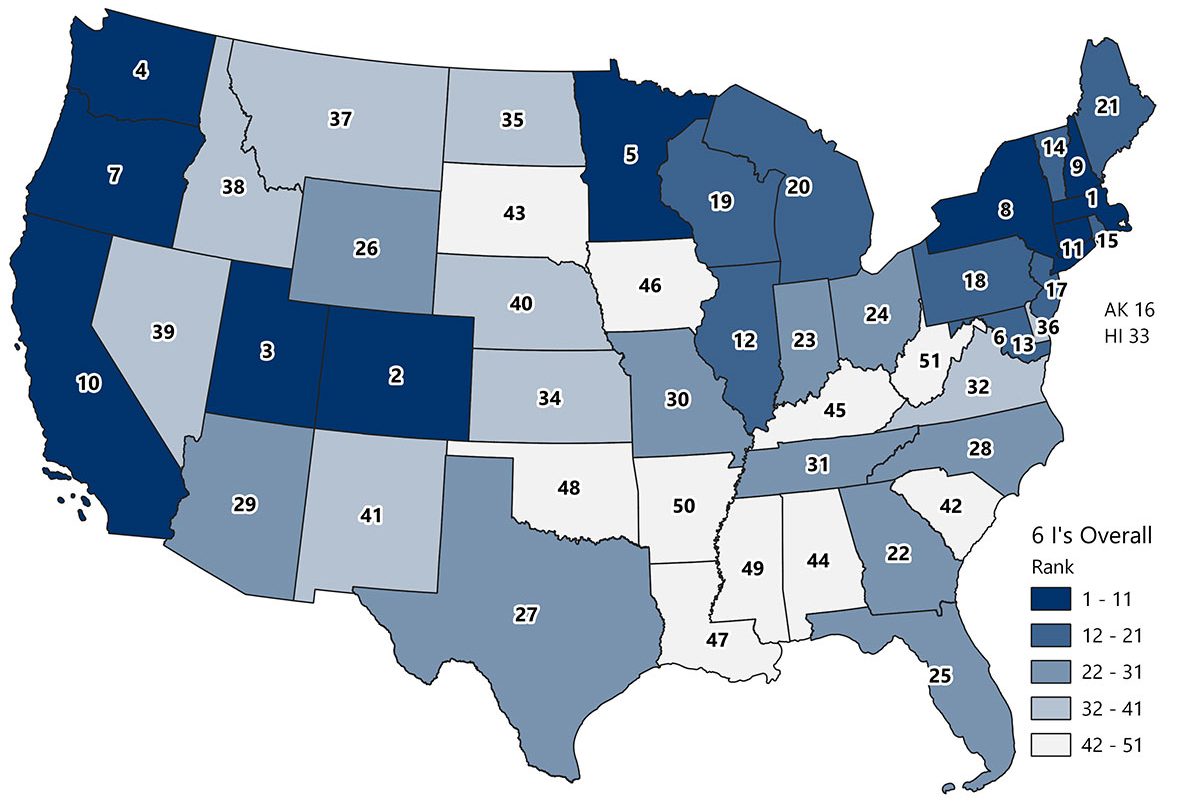 Source: Camoin Associates
But since we’re combining metrics as diverse as the number of general aviation and commercial air flights, the ratio of business births to deaths, the share of 8th-graders scoring at or above Proficient in reading, dollars of National Endowment for the Arts grants per capita, the average value of SBA loans per business, and new foreign direct investment as a share of GDP, for example, the indicators must first be converted into comparable units.
There are multiple ways to approach this. For our 6-I analysis, we rank the regions on each indicator value, then calculate each region’s average rank. Ranking is a straightforward technique that is easy to understand. Our Geographic Competitiveness index, however, takes a slightly more sophisticated approach. It converts each indicator value — say a market rent of $8.04 per square foot for industrial space in the Richmond, VA, MSA — into its “z score,” a measure of how far it is above or below the average rent across all MSAs.
While z scores are more difficult to understand, they do retain information about how similar regions are. A simple ranking approach loses that information, as we can’t say how far apart third and fourth places are, and it may be different than the distance between 23rd and 24th places. Z scores can then be added or averaged across metrics to generate a single score for each region.
Geographic Competitiveness Index for High-Tech Manufacturing in MSAs
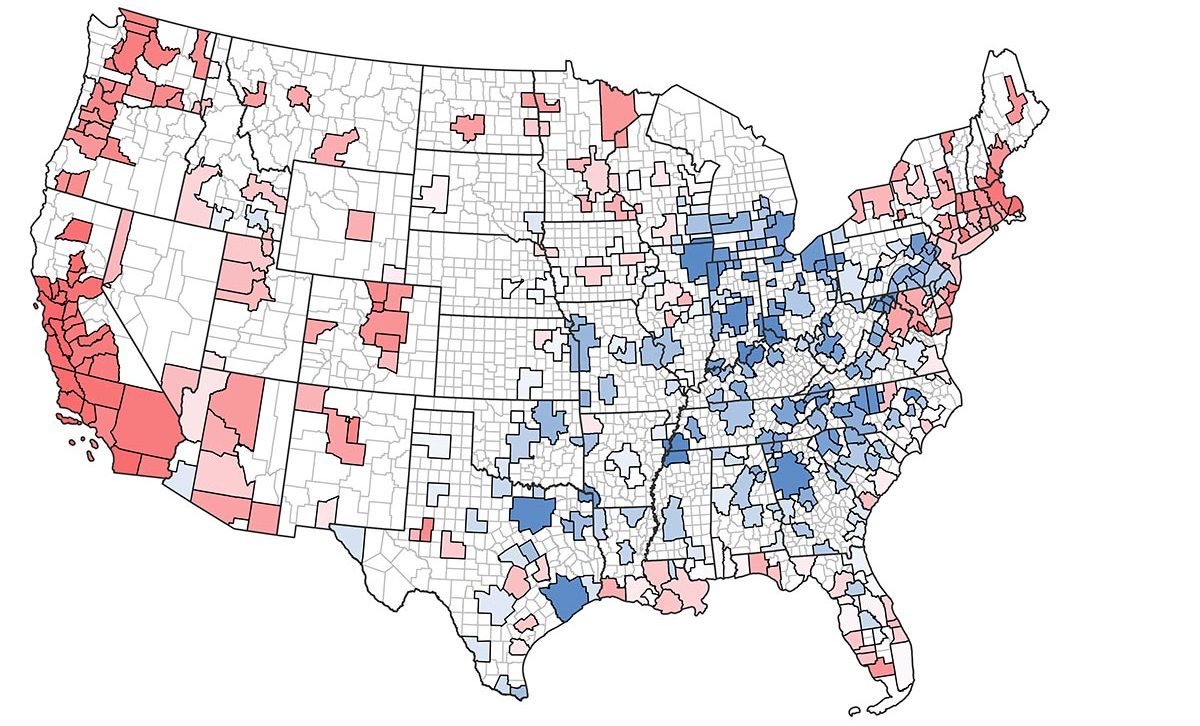 Note: MSAs in blue are more competitive/attractive; those in red are less competitive.
Source: Camoin Associates
Combining the values of disparate indicators into a single score allows regions to compare themselves with others. The underlying data provide insight into each region’s relative strengths and weaknesses, informing more effective strategies and policies.
_____________________________________
[1] There is the CPI and “Core” CPI, which omits the more volatile prices of food and energy items.
______________________________________
Camoin Associates is a national leader in using research and data analysis to help communities and organizations understand where they are now and develop actionable goals designed to get them where they want to be. Learn more about our services.

Real Estate Development and Housing
Ready to move your community forward? Discover how tailored market analysis and strategic public investments can unlock new development.

Industry Analytics and Strategy

Industry Analytics and Strategy
Your resource for understanding today and looking toward tomorrow