
- Navigator
- Expansion Solutions
- Industry Analytics and Strategy
- Workforce Development

Workforce is the top issue in economic development, as noted by the US Chamber of Commerce, the National Governor’s Association, and the Society for HR Management, among many, many others. To address this, economic developers are getting more involved in creating talent pipelines, and many now have dedicated staff to focus exclusively on workforce development.
Given the importance of workforce in economic development — and the fact that a region’s talent pipeline is one of its most important assets — it is critical to evaluate workforce strengths when determining target industries.
“Access to talent is the number-one concern for employers today, making it a top concern as well for EDOs that seek to attract, retain, and expand businesses in their communities.”
—Louise Anderson, Director of Research, International Economic Development Council
Most economic developers are familiar with the idea of targeted industries, i.e., industries that a region wishes to promote, grow, and attract because of existing strengths, growth potential, the promise of high-skill and high-wage jobs, and other reasons. The standard approach to target industry strategies focuses on the industry and its individual companies and what the region has to offer them. A workforce-based target industry strategy shifts the focus to view industries through the lens of local workers. It asks questions like:
The purpose of a workforce-based target industry analysis is to guide economic and workforce developers on ways to increase a region’s economic competitiveness with data and strategies based on the region’s unique talent assets and impending opportunities.
Talent-based target industries are not intended to replace traditionally defined target industries, but rather to supplement them in order to diversify the economic base, provide new opportunities for residents, and prevent brain drain. Fundamentally, this analysis showcases that a community recognizes the need for continuous improvement to become more effective and sustainable and compete in the global marketplace.
In this article, we will use the Akron, Ohio, metropolitan statistical area as a case study to demonstrate how target industries can be identified based on a region’s greatest asset — its people.
Many of the same indicators that economic developers use when identifying target industries can also be used to analyze the workforce.
Where companies are classified into industries based on how they produce their output using North American Industry Classification System (NAICS) codes, the workforce can be classified into occupations based on what workers do using Standard Occupational Classification (SOC) codes. Like NAICS codes, SOC codes range in detail from two digits (“major groups” like Computer and Mathematical Occupations) to six digits (“detailed occupations” like Software Developers). Just as one calculates a shift-share analysis or location quotients for industries in a region to compare it with the nation, the same can be done for occupations. A region may have specific occupations that perform better or worse than expected or are highly concentrated compared with the US.
Taking a workforce approach also sheds light on labor supply and demand factors. Regional postsecondary certificate and degree completions by academic field can be “matched” to occupations to evaluate the supply of labor produced by the area’s higher education establishments. This supply can be compared to the demand for labor in the form of projected occupational “openings” produced by state workforce boards. The resulting shortfalls and surpluses inform economic and workforce development strategies.
Occupations can be mapped to industries using staffing patterns. Staffing patterns identify the distribution of jobs in an industry across the occupations that it employs. For example, the Manufacturing industry uses a large number of Production Occupations, Transportation and Material Moving Occupations, and Architecture and Engineering Occupations. Staffing patterns serve as the bridge from an analysis of a region’s workforce strengths and opportunities to a determination of appropriate target industries.
As with target industry analysis, not all occupations are appropriate for targeting strategies.
For example, in the case study below Cashiers, Driver/Sales Workers, and Hairdressers, Hairstylists, and Cosmetologists appear within the top 10 occupations for multiple indicators. However, service occupations and industries like these that cater to local demand generally do not make suitable targets for attraction strategies.
Throughout the case study, the occupations that could potentially be relevant for a target industry strategy are highlighted.
To illustrate how to use occupational data to identify a region’s talent assets, we examined the occupational growth, concentration, competitive effect, commuting, and completion data for the Akron, Ohio, metropolitan statistical area (“Akron”). The data used in this case study is from Lightcast for the year 2022.
Akron is the fifth largest city in Ohio, with a population of nearly 700,000. Like many of the communities Camoin Associates works in, Akron’s population is slowly declining (-1% since 2018, compared to +1% in the state and +2% in the nation), as are jobs (-3% since 2018, compared to -2% in the state and +1% in the nation).
Previously known as the “Rubber Capital of the World,” Akron’s economy has been diversifying over the past few decades. Its current industry clusters include:
Large, fast-growth occupations indicate areas in which the regional economy is doing particularly well.
The occupations shown below are those that are growing the fastest within Akron. Of particular note from a target industry perspective are General and Operations Managers (+1,538 jobs over the past five years), Laborers and Freight, Stock, and Material Movers (+974 jobs), Industrial Truck and Tractor Operators (+775 jobs), Heavy and Tractor-Trailor Truck Drivers (+756 jobs), Stockers and Order Fillers (+693 jobs), Business Operations Specialists, All Other (+528 jobs), and Project Management Specialists (+506 jobs).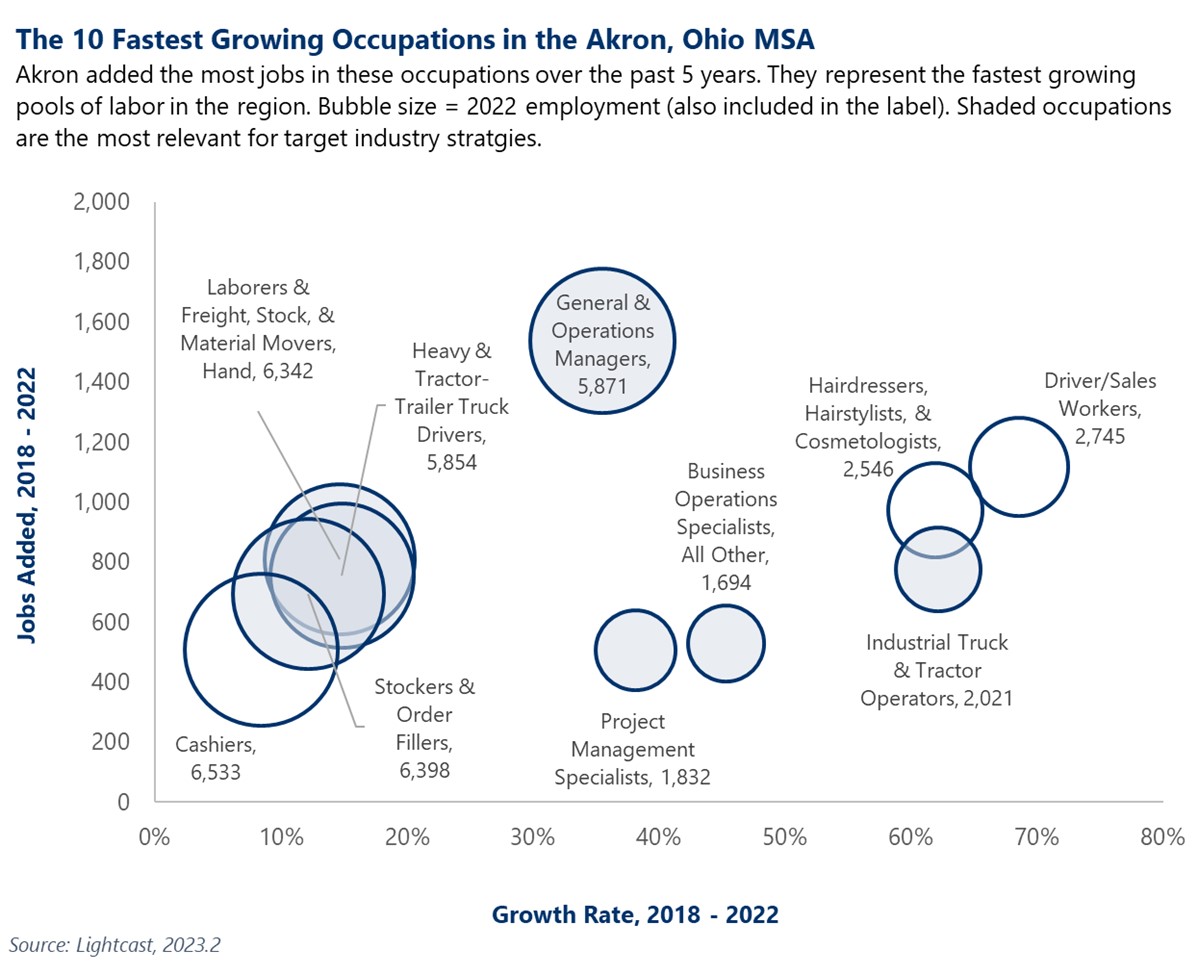
A location quotient (LQ) is the share a particular industry or occupation holds in a local economy divided by its share in the national economy. LQs greater than 1.00 indicate a local specialization and are often tied to an export activity, which brings money into the region and generates growth.
The graph below shows the occupations that are the most specialized in the region. Akron has particularly noteworthy concentrations of Agricultural Engineers (with an LQ of 9.96), Extruding, Forming, Pressing, and Compacting Machine Setters, Operators, and Tenders (4.98), Foundry Mold and Coremakers (4.26), and Metal and Plastic Patternmakers (4.12). These specializations would be attractive to industries that employ these occupations.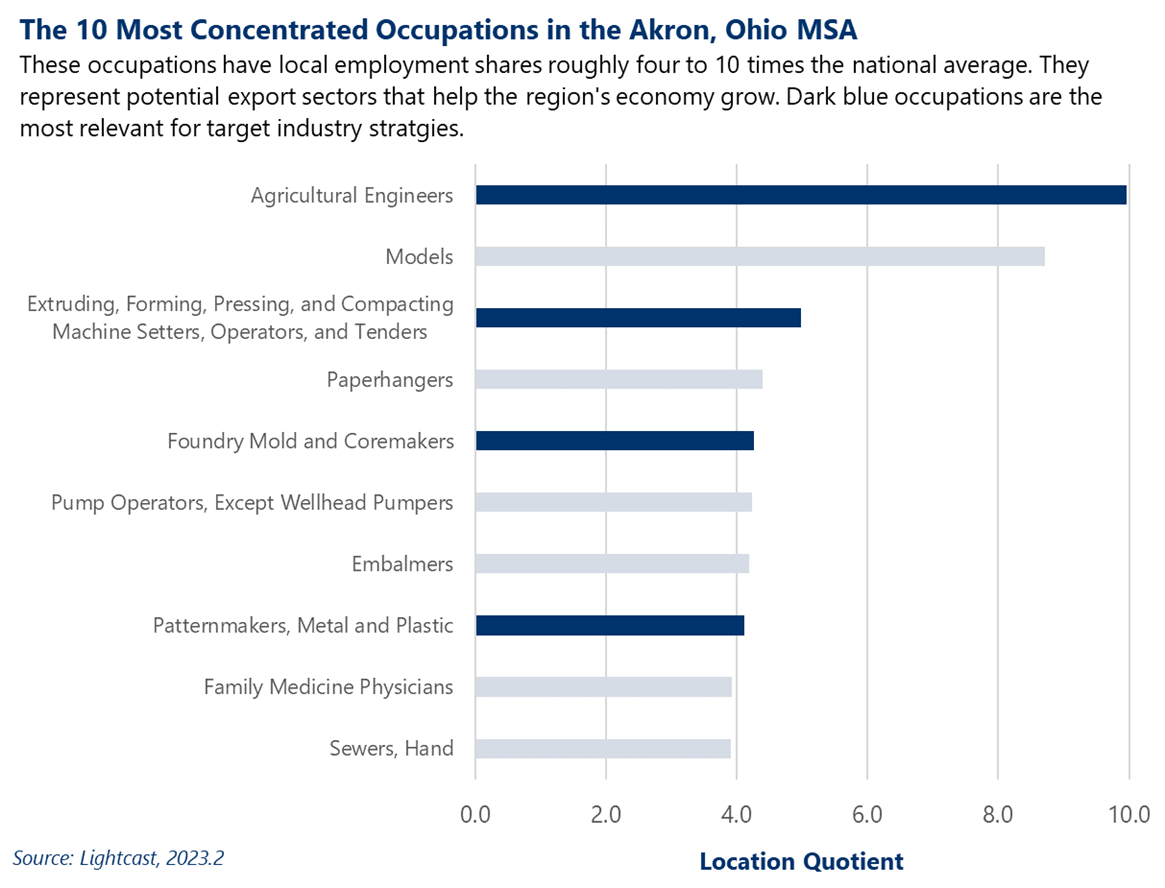
Shift-share analysis compares the economic performance of a region to what would be expected given national trends in the economy at large and in the industries or occupations present in the region. A positive “competitive effect” indicates that the region is particularly good at that activity, leading it to perform above expectations.
The graph below shows the occupations with the largest competitive effect. Of particular note are Laborers and Freight, Stock, and Material Movers, Hand (adding 778 more jobs than would be expected if Akron was following national and industry trends), Machinists (+397 jobs), Bookkeeping, Accounting, and Auditing Clerks (+346 jobs), and Industrial Truck and Tractor Operators (+321 jobs). Not only do these occupations represent strengths to build upon, but their extraordinary performance would be attractive to industries that employ these occupations.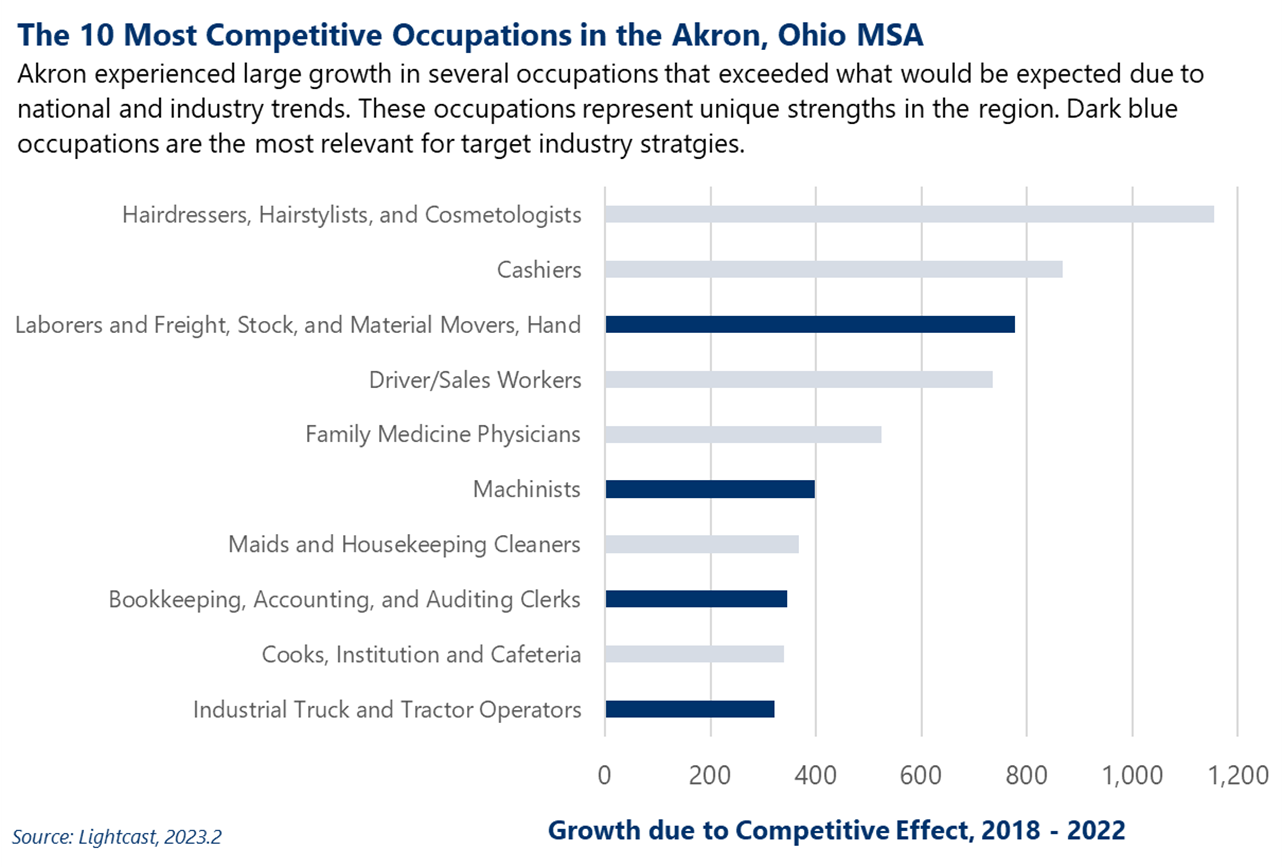
Any region has both workers who commute to local jobs from outside the region and residents who commute out to jobs in other areas. Outbound commuters represent workforce “leakage,” which is an indication there are not enough good jobs within the local labor shed to support residents in a given occupation.
About 360 of Akron’s 777 occupations with employment in 2022 saw net out-commuting last year. The graph below shows the occupations with the largest net out-commuting from Akron. Among those with the largest leakage were Miscellaneous Assemblers and Fabricators (losing a net 472 workers to out-commuting), Software Developers (-220 workers), Insurance Sales Agents (-207 workers), Accountants and Auditors (-200 workers), and Metal and Plastic Rolling Machine Setters, Operators, and Tenders (-168 workers). These occupations represent a pool of workers that are currently being underutilized by Akron’s businesses.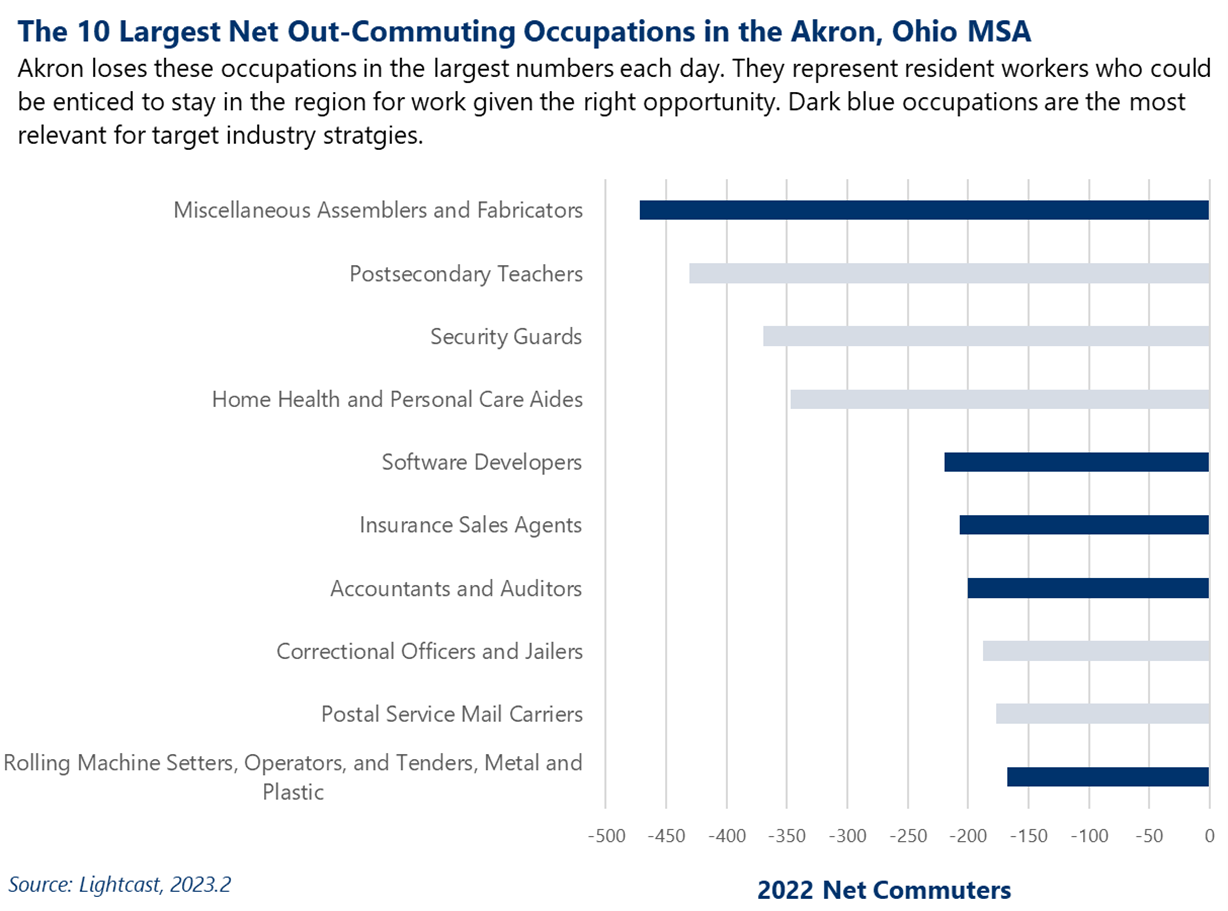
The talent pipeline generated by higher education institutions is one of a community’s greatest assets. Ideally, the programs and degrees offered by higher education institutions would align with the economic base of the region to supply a steady stream of workers for the occupations most in-demand by local employers.
Programs that do not align with the workforce needs of the region represent an untapped opportunity for economic developers. There is likely to be more “brain drain” in occupations that have significantly more completions than the number of job openings in the community.
Akron produced 12,358 graduates in 492 educational programs across 15 institutions in 2021. However, for about half of all occupations, there are not enough job openings available in the region to accommodate the full pipeline of graduates. The graph below shows the occupations with the largest surpluses of graduates. Of particular relevance are Managers, All Other (3,142 more graduates than job openings), Marketing Managers (1,691 more graduates), Project Management Specialists (1,387 more graduates), Business Operations Specialists (1,219 more graduates), Sales Managers (1,192 more graduates), and Financial Managers (1,178 more graduates). These talent pools are currently being underutilized in Akron and may be attractive to industries with high demand for these types of workers.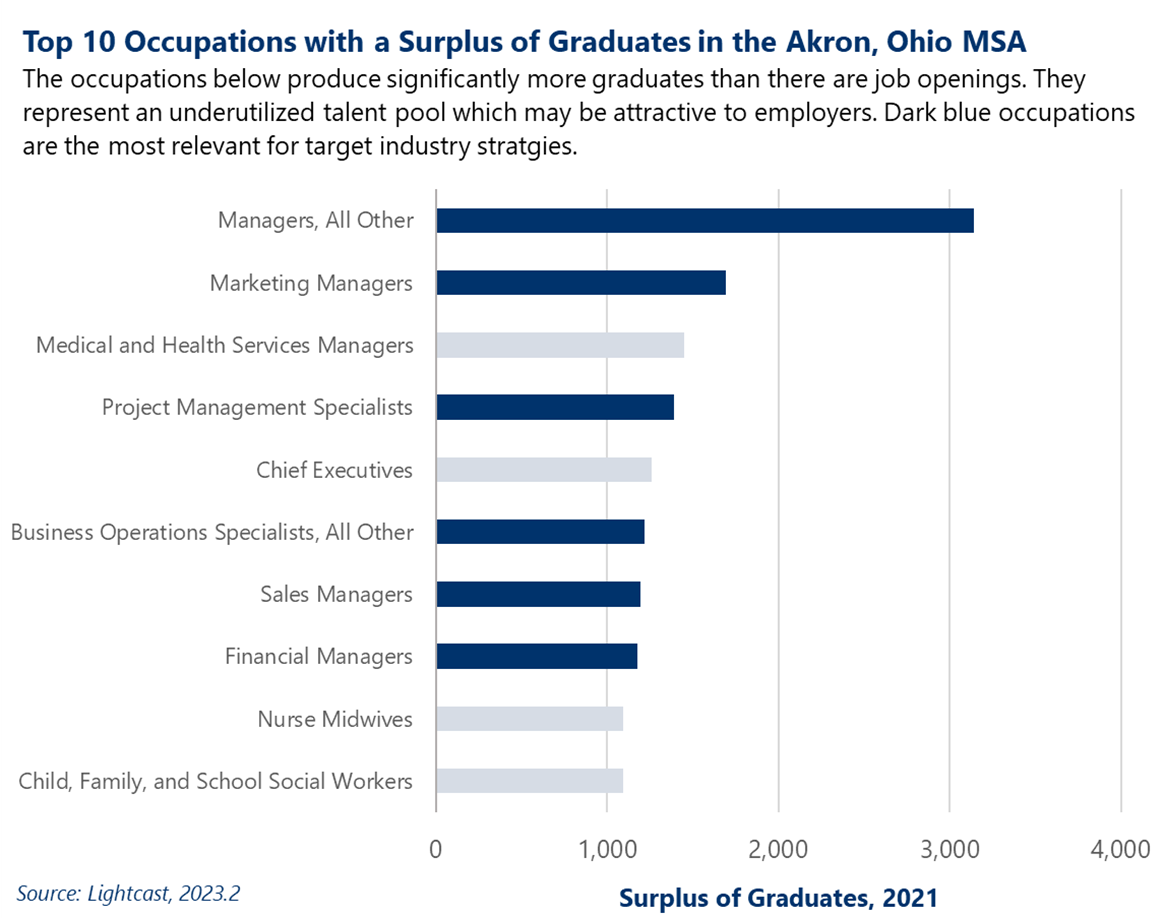
The preceding analyses resulted in the identification of 27 occupations that are either particular strengths (based on growth, specialization, or concentration) or sources of underutilized talent pools (commuters and educational surpluses) for the Akron MSA. After evaluating the inverse staffing pattern of each of these occupations, we identified 27 potential target industries that would employ at least 5% of each occupation.
Many of the industries identified via workforce indicators align with Akron’s existing target industries, such as Plastics Product Manufacturing, Automotive Manufacturing, Machinery, and Insurance Carriers. This validates the region’s existing targets and can provide useful data points for use in ongoing attraction and expansion efforts.
The occupations that do not align with existing target industries are shown below, along with the industries most likely to be interested in these talent pools and the share of the occupation that is typically employed in that industry. For example, about 12% of Marketing Managers work in the Management of Companies and Enterprises industry.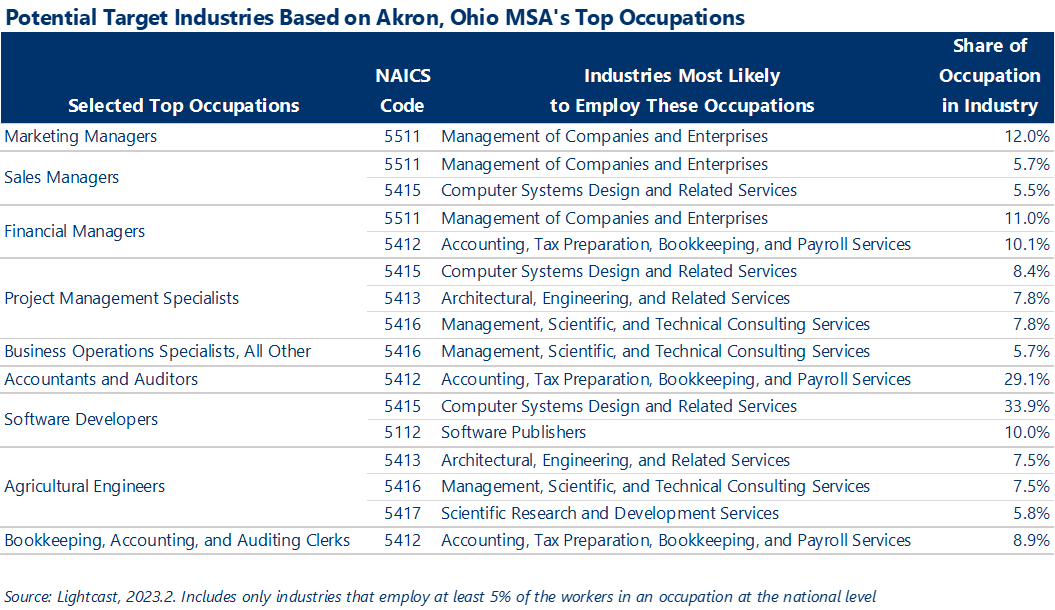
Many of the top occupations share common industries, particularly in the Management and Business and Financial Operations occupation groups. Overall, it appears there may be an opportunity for Akron to leverage its talent assets to grow the following industries while providing quality job opportunities for its existing residents:
These opportunities would not have emerged using a traditional targeted industry approach alone.
Identifying target industries through the lens of workforce development and talent retention allows a region to focus on its most in-demand assets — its people. In particular, considering talent retention metrics allows a region to highlight some of its high-skill talent, which a more traditional target industry study does not typically include.
By studying a region’s workforce strengths, we can identify the industries most likely to be attracted based on talent. Similarly, by providing the types of jobs that residents want, new or expanded industries can retain workers that might otherwise commute for work or move out of the area altogether (including college graduates). In this way, a workforce-based target industry analysis identifies industries that will best serve, and be served by, the region’s workforce.
The methodology outlined here is not intended to replace traditional target industry strategies; in fact, it can be complementary, as demonstrated in the Akron case study.
Learn about our Workforce Development and Talent Attraction Services

Economic and Fiscal Impact Analysis
A recent analysis of a digital equity program in Westchester County, NY, revealed that it generated outsized economic benefits and return on investment for the community.

Business Retention and Expansion (BRE)

Industry Analytics and Strategy
Your resource for understanding today and looking toward tomorrow