• Navigator
  • Industry Analytics and Strategy
  • Retail, Services, and Accommodations

It’s Wedding Season: How is Your Money Supporting the People Behind the Industry?

May 10, 2024 Tori Conroy and Connor Allen

A bride holding a large bouquet of flowers and a groom holding a multi-layered wedding cake with flowers on top stand togetherFlowers are blooming, long, colorful dresses are flowing in the spring breeze, and linen and seersucker suits are worn in the sunshine. This can only mean one thing: It is wedding season. My favorite time of the year.

This year is extra special because my fiancé and I are starting to plan our own June 2025 wedding. In addition, my colleague, Connor, is in the midst of planning his September 2024 wedding, and we have been discussing the where, who, and how much for the big and small details of our weddings over multiple coffee chats. These chats then inspired Connor and me to dive deeper into the economic side of the wedding industry.

Average Cost of a Wedding at a National Level

The average cost of a wedding varies depending on the state, venue, number of guests, type of food and drinks, etc. Across the United States, the average total cost of a wedding ranges from $14,500 to $50,000.

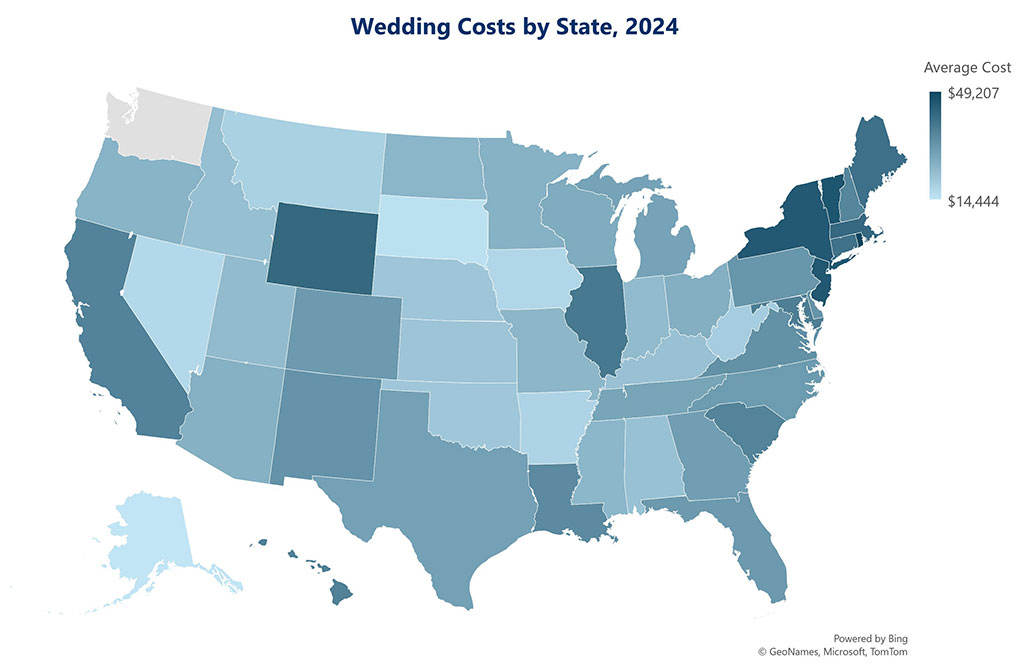
States with the highest average cost are primarily in the Northeast. Rhode Island ranks number one with the highest average wedding cost of $49,207, while weddings in Alaska average approximately $14,444.Table Title: Top 10 Most and Least Expensive States for a Wedding, 2024

This table compares the average wedding costs in the highest-priced and lowest-priced U.S. regions. Most Expensive States:

Rhode Island: $49,207

Washington DC: $47,917

Vermont: $46,167

New Jersey: $45,586

New York: $45,422

Wyoming: $42,000

Massachusetts: $41,579

Maine: $40,086

Connecticut: $39,844

Puerto Rico: $38,864

Least Expensive States:

Alaska: $14,444

South Dakota: $15,625

Nevada: $17,337

Iowa: $17,770

Arkansas: $18,438

Montana: $18,958

West Virginia: $19,688

Oklahoma: $21,094

Nebraska: $21,200

Kansas: $21,574

Data Source: Zola

Chart Title: Wedding Costs by State, 2024

This map shows the average cost of a wedding across the United States in 2024, with costs ranging from a low of $14,444 to a high of $49,207. Darker shades of teal indicate higher average costs, while lighter shades indicate lower average costs.

Highest Cost Regions: The most expensive weddings are concentrated in the Northeast (specifically Rhode Island, New York, New Jersey, and Massachusetts) and the mid-Atlantic (Washington D.C.), represented by the darkest teal shading. Wyoming and Illinois also show higher relative costs compared to their neighboring states.

Lowest Cost Regions: The least expensive weddings, represented by the lightest shades, are found in Alaska and throughout the Great Plains and Midwest, including states like South Dakota, Nebraska, Kansas, and Iowa.

Mid-Range Cost Regions: Much of the West, Southwest, and Southeast fall into the middle of the price spectrum, showing moderate shades of teal.

National Extremes: According to the data source, the single most expensive location is Rhode Island at $49,207, and the least expensive state is Alaska at $14,444.
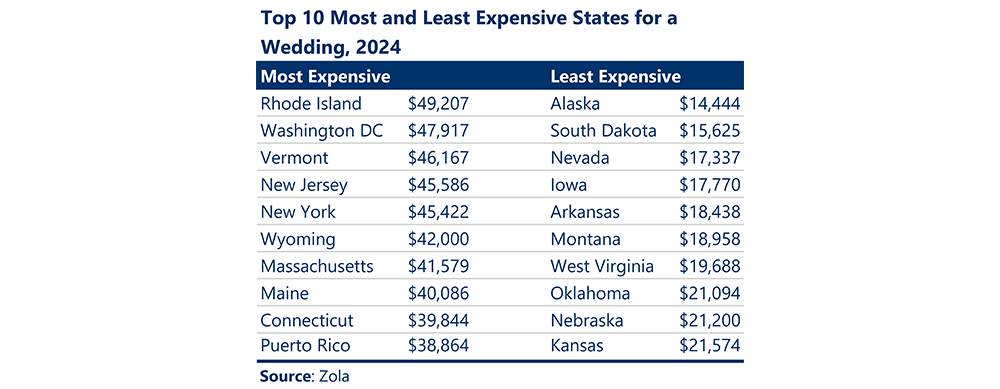
A different way to look at the average cost of a wedding is by its size because the number of guests ultimately dictates a large portion of the budget. A more intimate wedding (less than 100 people) averages between $11,700 and $25,000, while larger weddings require a larger budget ranging from $34,000 to $55,000.Table Title: Wedding Costs by Number of Guests, 2024

This table shows the average total cost of a wedding based on the size of the guest list.

Less than 10 guests: $11,667

10 to 30 guests: $17,048

30 to 50 guests: $18,768

50 to 75 guests: $20,581

75 to 100 guests: $24,769

100 to 150 guests: $33,957

150 to 200 guests: $41,286

200 to 300 guests: $42,751

500 or more guests: $54,500

Data Source: Zola

What Drives Wedding Expenses?

Wedding expenses are primarily spent in 11 categories. As expected, the venue, catering, and band/DJ are the biggest wedding expenses. The average cost for a wedding venue ranges from $6,500 to $12,000, while catering ranges from $6,500 to $10,000, equaling approximately half of an average wedding budget.Table Title: Wedding Costs by Expense, 2024

This table breaks down typical price ranges for individual wedding services.

Wedding Venue: $6,500 to $12,000

Catering: $6,500 to $10,000

Band and/or DJ: $2,000 to $7,000

Wedding Planner: $1,500 to $4,750

Photographer: $3,500 to $6,500

Videographer: $3,000 to $6,000

Flowers: $2,500 to $6,000

Transportation: $700 to $1,200

Cake: $600 to $900

Ceremony Music: $500 to $800

Hair and Makeup: $550 to $850

Data Source: Zola

Wedding Industry Occupation Trends

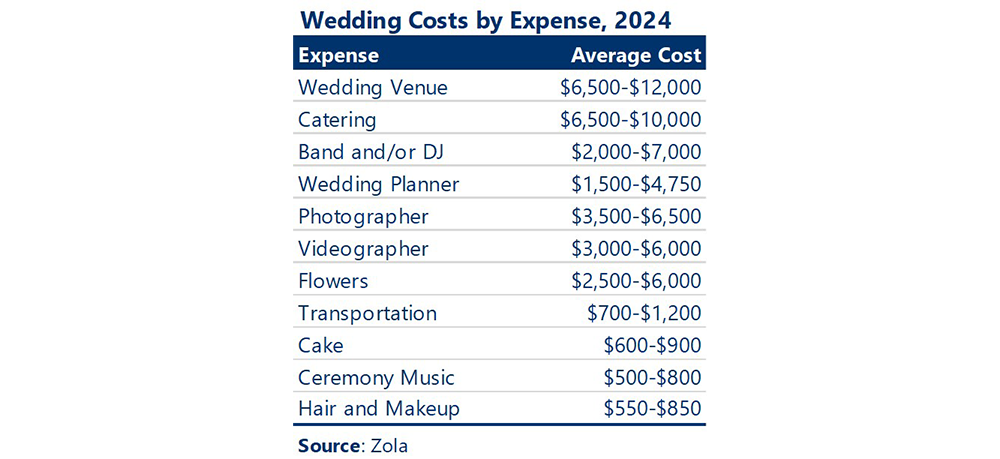
We used the 11 categories that people are primarily spending their wedding budgets on as a foundation to then look at occupation trends across the wedding industry. The highest job growth from 2018-2023 were Chefs and Head Cooks (29%), Disc Jockeys (22%), and Bakers (19%). These growing occupations align with what people spend most of their budget on for their weddings (catering and a band/DJ).

Occupations with job declines from 2018-2023 are Tailors, Dressmakers, and Custom Sewers (-17%), Musicians and Singers (-5%), and Food Servers, Nonrestaurant (-3%).

In recent years, there has been a shift towards renting and thrifting wedding wear with an eye on sustainability and affordability and less emphasis on each person in the wedding party wearing the same suit or dress. This trend could account for a decrease in the Tailors, Dressmakers, and Custom Sewer occupations.Table Title: Wedding Occupations Growth, 2018-2023

This table tracks job volume and salary changes for fourteen occupations.

Food Service Managers: 330,980 jobs, 9% growth. Median annual salary: $57,077.03 (15% increase).

Meeting, Convention, and Event Planners: 139,276 jobs, 6% growth. Median annual salary: $52,737.65 (6% increase).

Floral Designers: 53,107 jobs, 2% growth. Median annual salary: $32,919.12 (19% increase).

Musicians and Singers: 176,311 jobs, 5% decrease. Median annual salary: $62,007.19 (21% increase).

Disc Jockeys, Except Radio: 15,227 jobs, 22% growth. Median annual salary: $44,616.98 (21% increase).

Photographers: 143,683 jobs, 5% growth. Median annual salary: $42,884.75 (14% increase).

Chefs and Head Cooks: 197,307 jobs, 29% growth. Median annual salary: $54,306.03 (17% increase).

Cooks, Restaurant: 1,445,737 jobs, 4% growth. Median annual salary: $34,063.57 (29% increase).

Bartenders: 655,677 jobs, 2% growth. Median annual salary: $29,346.75 (30% increase).

Food Servers, Nonrestaurant: 263,204 jobs, 3% decrease. Median annual salary: $30,296.65 (30% increase).

Dining Room and Cafeteria Attendants and Bartender Helpers: 466,904 jobs, 1% growth. Median annual salary: $29,095.95 (31% increase).

Bakers: 234,102 jobs, 19% growth. Median annual salary: $32,586.70 (23% increase).

Tailors, Dressmakers, and Custom Sewers: 35,253 jobs, 17% decrease. Median annual salary: $31,761.00 (16% increase).

Laborers and Freight, Stock, and Material Movers, Hand: 3,023,405 jobs, 1% growth. Median annual salary: $36,068.44 (28% increase).

Total for all occupations: 7,180,172 jobs, 3% growth. Median annual salary: $35,066.01 (26% increase).

Data Source: Lightcast

What Does This Mean for Economic Development?

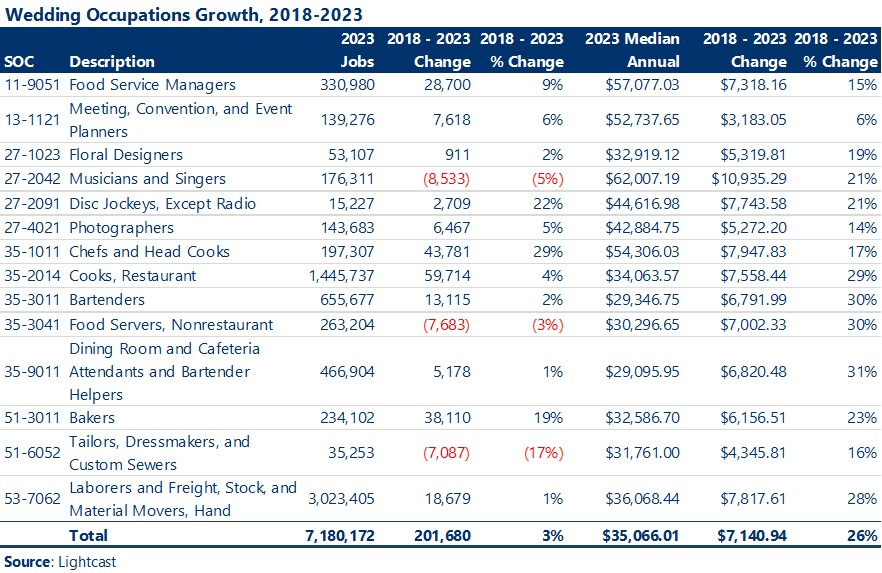
As wedding budgets continue to increase year-over-year, the occupations most closely associated with weddings continue to benefit, having seen a wage increase of 26% since 2018 (compared to a 10% increase across all occupations in the US). The wedding industry also boasts low barriers to entry and can be an opportunity for people who are newly joining the workforce or changing careers. Of the 14 wedding occupations listed in the table below, nine occupations require no formal education credentials, 11 require no previous work experience, and nine require either no, or only short-term, on-the-job training.

Connecting diverse populations to occupations, building career pathways, and upskilling people can meet the growing needs in the wedding industry while developing people’s career along the way.Table Title: Wedding Occupations Education, Experience, and Training Level, 2023

This table lists fourteen wedding-related occupations by SOC code and description, detailing their entry-level requirements.

Food Service Managers (11-9051): High school diploma or equivalent, less than 5 years experience, no on-the-job training.

Meeting, Convention, and Event Planners (13-1121): Bachelor's degree, no experience required, no on-the-job training.

Floral Designers (27-1023): High school diploma or equivalent, no experience required, moderate-term on-the-job training.

Musicians and Singers (27-2042): No formal educational credential, no experience required, long-term on-the-job training.

Disc Jockeys, Except Radio (27-2091): No formal educational credential, no experience required, short-term on-the-job training.

Photographers (27-4021): High school diploma or equivalent, no experience required, moderate-term on-the-job training.

Chefs and Head Cooks (35-1011): High school diploma or equivalent, 5 years or more experience, no on-the-job training.

Cooks, Restaurant (35-2014): No formal educational credential, less than 5 years experience, moderate-term on-the-job training.

Bartenders (35-3011): No formal educational credential, no experience required, short-term on-the-job training.

Food Servers, Non-restaurant (35-3041): No formal educational credential, no experience required, short-term on-the-job training.

Dining Room and Cafeteria Attendants and Bartender Helpers (35-9011): No formal educational credential, no experience required, short-term on-the-job training.

Bakers (51-3011): No formal educational credential, no experience required, long-term on-the-job training.

Tailors, Dressmakers, and Custom Sewers (51-6052): No formal educational credential, no experience required, moderate-term on-the-job training.

Laborers and Freight, Stock, and Material Movers, Hand (53-7062): No formal educational credential, no experience required, short-term on-the-job training.

Data Source: Lightcast

Ultimately, weddings bring people from all over the world together in one place. That place could be your community, and these visitors could create economic opportunities in accommodations, hospitality, and tourism-focused industries.

Connect with wedding planners and venues to supply them with your community’s local tourism magazine, brochure, website, etc. to encourage visitors to stay longer and experience your community when they are not attending wedding activities.

If you are interested in discussing workforce development, industry analysis, and supporting budding entrepreneurs, please contact me at Tori@camoinassociates.com.