• Navigator
  • Featured Indicator
  • Industry Analytics and Strategy
  • National

Complete Quick Cluster Analyses With This Peer City Identification Tool

November 3, 2022 Jessica Tagliafierro

A map of the United States with one yellow pin in Colorado showing a primary city location and a bunch of smaller orange pins showing its peer citiesThe Federal Reserve Bank of Chicago offers a Peer City Identification Tool that allows users to conduct a quick cluster analysis to identify groups of similar cities along economic, demographic, social, and housing dimensions.

The tool draws on city-level indicators from the American Community Survey and decennial US census to provide data comparison and visualization that can help policymakers better understand a municipality within the context of its peer cities.

The Peer City Identification Tool includes coverage of 960 places from around the United States that were either incorporated with a population of at least 25,000 by the 1960 census or incorporated with a population of at least 50,000 by the 2010 census.

Peer cities are grouped along four key themes:

  • Equity: addresses questions regarding inclusion, access, and diversity using the wage-based Gini coefficient, race and ethnicity-based dissimilarity indices, changes in poverty levels, and educational attainment.
  • Resilience: speaks to issues related to economic diversification by considering current conditions and trends in manufacturing employment, labor force participation, and unemployment.
  • Outlook: explores signs of a city’s demographic and economic future by incorporating immigration, family composition, age structure, and changes in total population. The age distribution of a population, net migration, and family composition provide clues about a city’s future.
  • Housing: speaks to issues of affordability by incorporating data relating to home ownership (income-to-home value ratio and homeownership rate) and renting (rent burden), the quality and competitiveness of housing stock (using the age of housing as a proxy), and housing vacancies.

What is the Data Telling Us?

Michigan’s capital city, Lansing, is used here to illustrate the utility of the tool. The tool allows you to pull a unique set of peers for each of the four themes.

For example, Lansing has 14 peer cities in the equity theme, including places such as Niagara Falls, NY, and St. Cloud, MN.

This table presents a detailed comparison of Lansing, Michigan, with a group of 14 peer cities and a peer group median across several equity-related indicators. The data source is the Federal Reserve Bank of Chicago. 

The table is arranged with cities listed in rows and nine indicators shown as columns. The data helps illustrate differences in racial segregation, poverty, inequality, demographics, and educational attainment across these communities.

Indicators Included in the Table:

Hispanic-white dissimilarity index: Measures how evenly Hispanic and white residents are distributed across neighborhoods (higher values indicate greater segregation).

Black–white dissimilarity index: Measures how evenly Black and white residents are distributed across neighborhoods.

Poverty rate: Percentage of individuals living below the federal poverty line.

Change in poverty rate (2000–2020): Increase or decrease in the local poverty rate over two decades.

Wage-based Gini coefficient: A measure of income inequality (higher values indicate more inequality).

Change in inequality index (2008–2014): How income inequality shifted over time.

Percent white: Percentage of the population identifying as white.

Percent with a bachelor’s degree: Share of the adult population with at least a four-year degree.

Share of metropolitan area population: Proportion of the metro region’s total population that lives within the city.

Peer Group Median Values:

The median across all peer cities serves as a benchmark.

Hispanic–white dissimilarity: 31.5

Black–white dissimilarity: 37.0

Poverty rate: 16.0%

Poverty change: +4.7%

Gini coefficient: 0.2933

Inequality change: +0.0043

Percent white: 76.7%

Bachelor’s degree attainment: 19.8%

Share of metro population: 31.8%

Lansing’s Position Relative to Peers:

Hispanic–white dissimilarity: 32.8 (slightly above median)

Black–white dissimilarity: 40.3 (above median)

Poverty rate: 22.1% (notably above median)

Change in poverty rate: +5.3% (slightly above median)

Gini coefficient: 0.3024 (above median, indicating greater inequality)

Change in inequality: +0.0044 (similar to median)

Percent white: 53.5% (much lower than median, indicating higher racial diversity)

Bachelor’s degree attainment: 26.3% (above median)

Share of metro population: 66.0% (significantly higher than median)

Overall Context:

The table shows that Lansing has:

Higher residential segregation than the typical peer city.

Higher poverty and higher income inequality.

Greater racial diversity, with a much lower percentage of white residents than most peers.

Above-average educational attainment.

A large share of its region’s population, making it a central population hub compared to other cities in the peer group.

Data Source: Federal Reserve Bank of ChicagoIn terms of resilience however, only five peers are returned based on measures such as unemployment, labor force participation, and share of metropolitan area population. Only Bay City, MI, is a peer for Lansing in both equity and resilience.

Table Title: Lansing, Michigan, Resilience Peer Group

This table presents comparative economic data for Lansing, Michigan, and six of its Resilience Peer Cities as of November 2022, sourced from the Federal Reserve Bank of Chicago. The data includes a Peer Group Median for quick comparison. The table has seven rows—one for the Peer Group Median and one for each of the seven cities—and eight columns detailing different economic indicators.

Peer Group Median:
Unemployment rate: 8.4%
Labor force participation rate: 60.9%
Change in labor force participation rate: -1.1%
Labor share of manufacturing: 14.2%
Change, labor share of manufacturing, 1970-2020: -61.5%
Median family income, 2000-2020: $52,089
Change in median family income, 2000-2020: -13.4%
Share of metropolitan area population: 28.0%

Data for Individual Peer Cities and Lansing, Michigan:
Akron, Ohio
Unemployment rate: 8.8%
Labor force participation rate: 63.5%
Change in labor force participation rate: -0.7%
Labor share of manufacturing: 13.9%
Change, labor share of manufacturing, 1970-2020: -63.8%
Median family income, 2000-2020: $50,102
Change in median family income, 2000-2020: -18.1%
Share of metropolitan area population: 28.1%

Bay City, Michigan:
Unemployment rate: 7.9%
Labor force participation rate: 60.8%
Change in labor force participation rate: -1.4%
Labor share of manufacturing: 14.2%
Change, labor share of manufacturing, 1970-2020: -61.6%
Median family income, 2000-2020: $49,319
Change in median family income, 2000-2020: -17.0%
Share of metropolitan area population: 31.8%

Erie, Pennsylvania:
Unemployment rate: 8.1%
Labor force participation rate: 60.0%
Change in labor force participation rate: -0.9%
Labor share of manufacturing: 15.2%
Change, labor share of manufacturing, 1970-2020: -62.3%
Median family income, 2000-2020: $51,035
Change in median family income, 2000-2020: -9.8%
Share of metropolitan area population: 35.5%

Kingsport, Tennessee:
Unemployment rate: 6.3%
Labor force participation rate: 52.5%
Change in labor force participation rate: 0.1% (The only positive change in this category)
Labor share of manufacturing: 16.5% (Highest share among the cities)
Change, labor share of manufacturing, 1970-2020: -61.3%
Median family income, 2000-2020: $59,047 (Highest median income among the cities)
Change in median family income, 2000-2020: -5.4% (Smallest decline among the cities)
Share of metropolitan area population: 17.5% (Smallest share)

Lansing, Michigan:
Unemployment rate: 9.6% (Highest rate among the cities)
Labor force participation rate: 67.3% (Highest rate among the cities)
Change in labor force participation rate: -1.3%
Labor share of manufacturing: 10.6% (Lowest share among the cities)
Change, labor share of manufacturing, 1970-2020: -59.3% (Smallest decline in this category)
Median family income, 2000-2020: $53,143
Change in median family income, 2000-2020: -17.1%
Share of metropolitan area population: 21.4%

Peoria, Illinois:
Unemployment rate: 9.7%
Labor force participation rate: 61.0%
Change in labor force participation rate: -1.2%
Labor share of manufacturing: 14.2%
Change, labor share of manufacturing, 1970-2020: -52.8%
Median family income, 2000-2020: $69,414
Change in median family income, 2000-2020: -4.7%
Share of metropolitan area population: 27.9%Twelve of Lansing’s peers are identified on measures related to outlook, including data on percent of foreign-born population and percent change in population. Akron, OH, appears on the peer lists for both resilience and outlook.

This table presents comparative demographic data for Lansing, Michigan, and 11 of its Outlook Peer Cities, sourced from the Federal Reserve Bank of Chicago. The data includes a Peer Group Median for comparison. 

Peer Group Median Values:
Peer Cities: Lists the cities and the Peer Group Median.
Percent foreign-born: 6.0%
Percent change in population, 2000-2020: 0.8%
Percent of families with children: 48.4%
Percent of population 20-64: 60.5%
Total population: 189,994
Share of metropolitan area population: 26.7%

Data for Individual Peer Cities and Lansing, Michigan:
Akron, Ohio:
Percent foreign-born: 6.8%
Percent change in population, 2000-2020: -9.1% (Largest decline)
Percent of families with children: 48.3%
Percent of population 20-64: 60.7%
Total population: 197,375
Share of metropolitan area population: 28.1%

Baton Rouge, Louisiana:
Percent foreign-born: 5.5%
Percent change in population, 2000-2020: -2.5%
Percent of families with children: 45.7%
Percent of population 20-64: 59.5%
Total population: 222,191
Share of metropolitan area population: 25.9%

Columbia, South Carolina:
Percent foreign-born: 5.0%
Percent change in population, 2000-2020: 15.3% (Largest increase)
Percent of families with children: 50.2%
Percent of population 20-64: 62.0%
Total population: 134,057
Share of metropolitan area population: 16.1%

Evansville, Indiana:
Percent foreign-born: 3.2%
Percent change in population, 2000-2020: -2.6%
Percent of families with children: 46.5%
Percent of population 20-64: 60.5%
Total population: 118,414 (Smallest population)
Share of metropolitan area population: 37.6%

Grand Rapids, Michigan:
Percent foreign-born: 11.1% (Highest percentage)
Percent change in population, 2000-2020: 0.8%
Percent of families with children: 49.6%
Percent of population 20-64: 61.8%
Total population: 199,417
Share of metropolitan area population: 18.6%

Knoxville, Tennessee:
Percent foreign-born: 6.1%
Percent change in population, 2000-2020: 7.8%
Percent of families with children: 48.6%
Percent of population 20-64: 63.0% (Highest percentage)
Total population: 187,487
Share of metropolitan area population: 21.8%

Lansing, Michigan:
Percent foreign-born: 10.0%
Percent change in population, 2000-2020: -1.4%
Percent of families with children: 49.4%
Percent of population 20-64: 62.5%
Total population: 117,488
Share of metropolitan area population: 21.4%

Little Rock, Arkansas:
Percent foreign-born: 7.3%
Percent change in population, 2000-2020: 8.2%
Percent of families with children: 48.8%
Percent of population 20-64: 60.0%
Total population: 198,067
Share of metropolitan area population: 26.7%

Mobile, Alabama:
Percent foreign-born: 3.4%
Percent change in population, 2000-2020: -4.5%
Percent of families with children: 44.6% (Lowest percentage)
Percent of population 20-64: 59.4% (Lowest percentage)
Total population: 189,994
Share of metropolitan area population: 44.2% (Highest share)

Newport News, Virginia:
Percent foreign-born: 7.5%
Percent change in population, 2000-2020: -0.3%
Percent of families with children: 49.1%
Percent of population 20-64: 60.4%
Total population: 179,582
Share of metropolitan area population: 10.2% (Lowest share)

Richmond County (Augusta), Georgia:
Percent foreign-born: 3.5%
Percent change in population, 2000-2020: 1.2%
Percent of families with children: 46.4%
Percent of population 20-64: 60.0%
Total population: 202,178
Share of metropolitan area population: 33.4%

Savannah, Georgia:
Percent foreign-born: 6.0%
Percent change in population, 2000-2020: 10.6%
Percent of families with children: 47.2%
Percent of population 20-64: 61.4%
Total population: 145,492
Share of metropolitan area population: 37.3%

Spokane, Washington:
Percent foreign-born: 5.9%
Percent change in population, 2000-2020: 12.0%
Percent of families with children: 48.4%
Percent of population 20-64: 60.5%
Total population: 219,185
Share of metropolitan area population: 39.2%Within the housing theme, 11 peers are identified, again including Akron, OH. Peers in this theme are based on data related to age of housing stock, homeownership rates, and percent of rent-burdened households, among others.

Description of Table: Lansing, MI - Housing Peer Group

This table presents comparative housing data for Lansing, Michigan, and 11 of its Housing Peer Cities, sourced from the Federal Reserve Bank of Chicago. The data includes a Peer Group Median for comparison. 

Peer Group Median:
Percent of housing units built pre-1980: 82.0%
Vacancy rate: 11.4%
Home value to income ratio: 2.5
Homeownership rate: 50.5%
Percent rent-burdened households: 50.3%
Share of metropolitan area population: 21.4%

Data for Individual Peer Cities and Lansing, Michigan:

Akron, Ohio:
Percent of housing units built pre-1980: 82.8%
Vacancy rate: 11.2%
Home value to income ratio: 2.1
Homeownership rate: 50.4%
Percent rent-burdened households: 50.2%
Share of metropolitan area population: 28.1%

Bangor, Maine:
Percent of housing units built pre-1980: 71.5%
Vacancy rate: 10.7%
Home value to income ratio: 3.3
Homeownership rate: 47.9%
Percent rent-burdened households: 48.7%
Share of metropolitan area population: 21.1%

Canton, Ohio:
Percent of housing units built pre-1980: 88.5%
Vacancy rate: 12.9%
Home value to income ratio: 2.2
Homeownership rate: 47.7% (Lowest rate)
Percent rent-burdened households: 50.3%
Share of metropolitan area population: 17.8%

Elkhart, Indiana:
Percent of housing units built pre-1980: 72.2%
Vacancy rate: 11.7%
Home value to income ratio: 2.4
Homeownership rate: 50.5%
Percent rent-burdened households: 49.4%
Share of metropolitan area population: 25.7%

Erie, Pennsylvania:
Percent of housing units built pre-1980: 88.1%
Vacancy rate: 10.4% (Tied for lowest rate)
Home value to income ratio: 2.3
Homeownership rate: 52.0%
Percent rent-burdened households: 51.8%
Share of metropolitan area population: 35.5%

Lansing, Michigan:
Percent of housing units built pre-1980: 81.2%
Vacancy rate: 10.4% (Tied for lowest rate)
Home value to income ratio: 2.0 (Lowest ratio)
Homeownership rate: 51.5%
Percent rent-burdened households: 50.7%
Share of metropolitan area population: 21.4%

Muskegon, Michigan:
Percent of housing units built pre-1980: 84.2%
Vacancy rate: 14.1%
Home value to income ratio: 2.2
Homeownership rate: 49.9%
Percent rent-burdened households: 51.2%
Share of metropolitan area population: 21.5%

North Little Rock, Arkansas:
Percent of housing units built pre-1980: 61.0% (Lowest percentage)
Vacancy rate: 12.7%
Home value to income ratio: 3.3 (Tied for second highest ratio)
Homeownership rate: 47.6%
Percent rent-burdened households: 48.3% (Lowest percentage)
Share of metropolitan area population: 8.9% (Lowest share)

Norwich, Connecticut:
Percent of housing units built pre-1980: 76.4%
Vacancy rate: 14.3% (Highest rate)
Home value to income ratio: 3.0
Homeownership rate: 53.0% (Highest rate)
Percent rent-burdened households: 49.5%
Share of metropolitan area population: 14.7%

Philadelphia, Pennsylvania:
Percent of housing units built pre-1980: 86.7%
Vacancy rate: 11.0%
Home value to income ratio: 3.5 (Highest ratio)
Homeownership rate: 52.8%
Percent rent-burdened households: 52.2%
Share of metropolitan area population: 26.0%

Racine, Wisconsin:
Percent of housing units built pre-1980: 89.1% (Highest percentage)
Vacancy rate: 8.3%
Home value to income ratio: 2.6
Homeownership rate: 52.4%
Percent rent-burdened households: 53.3% (Highest percentage)
Share of metropolitan area population: 39.3% (Highest share)

Spartanburg, South Carolina:
Percent of housing units built pre-1980: 70.9%
Vacancy rate: 13.0%
Home value to income ratio: 3.1
Homeownership rate: 50.2%
Percent rent-burdened households: 49.0%
Share of metropolitan area population: 11.9%Identification of peers is not always a black and white process that can be completed using the sample of indicators used here. In cases where users have other peer cities in mind, the tool provides flexibility in allowing users to add cities to the list that are not returned by default.

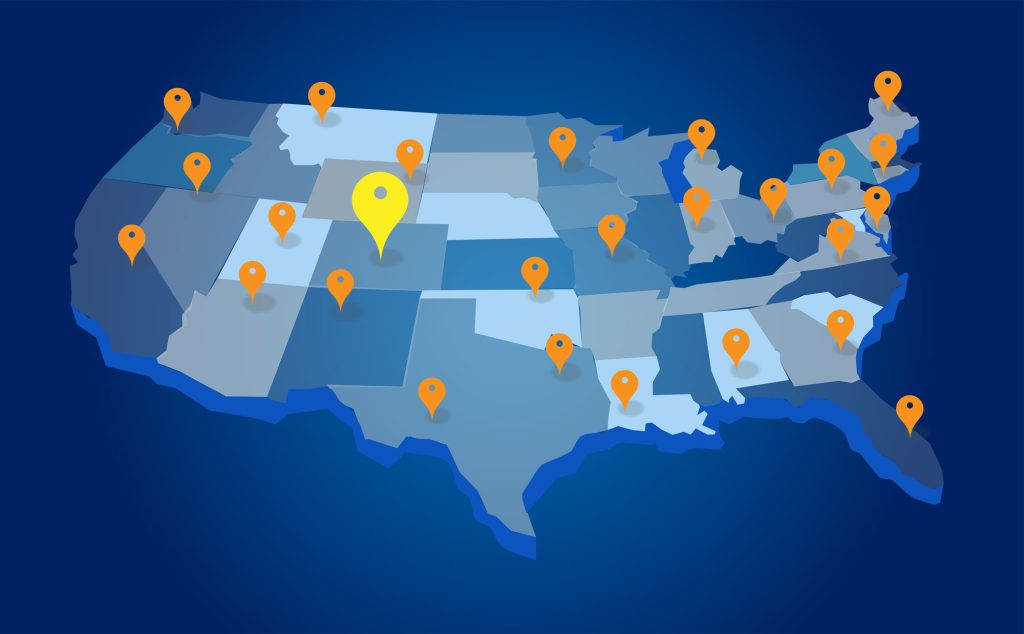
In addition to the data tables, a map of peer city locations is available on the site. Below is an example of the map, displaying Lansing’s housing peers, with College Station, TX, added as a custom peer. On the Federal Reserve Bank of Chicago’s site, the map is interactive; hovering over any city shows users the name of that city which can then be selected to update the data and return peers for the selected city.

A map of the United States show locations of Lansing, Michigan, and its peer cities from previous tables
Source: Federal Reserve Bank of Chicago

Why is Peer City Identification Important?

Through our work, we’ve found that there is often a desire by communities to benchmark their performance against similar cities. This type of comparison can be useful for communities that are working to develop a strategic plan, expand an industry, or identify real estate gaps. But if a community hasn’t already identified its peer cities, a comparison can be challenging to complete and requires extensive research.

The Federal Reserve Bank of Chicago’s Peer City Identification Tool offers a quick and easy way to identify potential locations against which cities can benchmark themselves. This is a good starting place to generate ideas for similar places, while also allowing flexibility for the addition of custom peer cities.

Camoin Associates is a national leader in using research and data analysis to help communities and organizations understand where they are now and develop actionable goals designed to get them where they want to be.

Learn more about our industry analytics and strategy services