• Navigator
  • Featured Indicator
  • Entrepreneurship and Innovation
  • National

Featured Indicator: StatsAmerica’s Innovation Intelligence Index

May 10, 2022 Jessica Tagliafierro

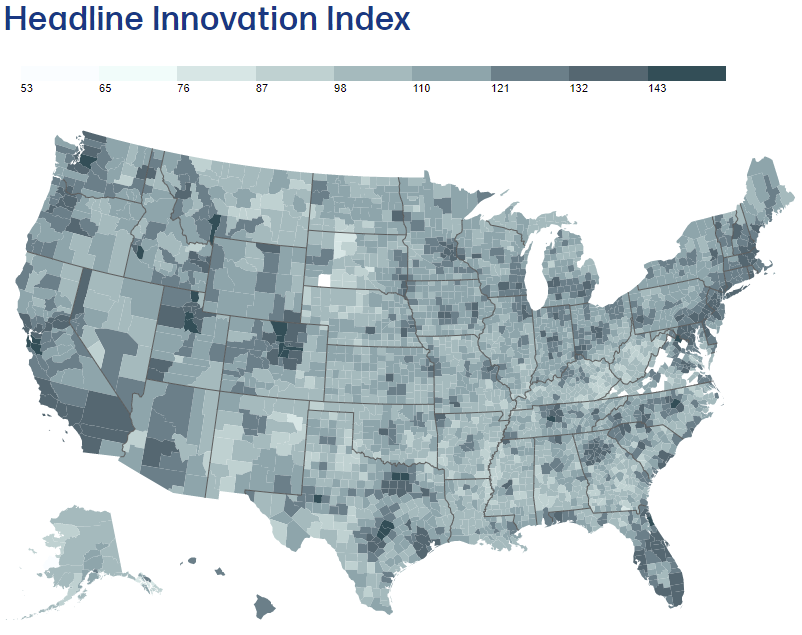
StatsAmerica’s Innovation Intelligence Index (II3) is a great tool for exploring regional data related to innovation and entrepreneurship. II3 provides a set of data and tools that can be used to understand a region’s weaknesses, strengths, and potential.

The headline index is calculated from five core indices that cover innovation inputs and outputs, with each index being weighted equally:

Innovation Inputs

  • Human Capital and Knowledge Creation: educational attainment, patents, STEM occupations, etc.
  • Business Dynamics: establishment formation, expansions/contractions, births/deaths, etc.
  • Business Profile: venture capital, foreign direct investment, proprietorship, etc.

Innovation Outputs

  • Employment and Productivity: industry performance, gross domestic product, etc.
  • Economic Well-Being: income, poverty, unemployment, migration, etc.

The index is best used as a comparison tool. In other words, a specific index level is not tied to a particular innovation outcome. Index scores for a region are relative to the United States, however, regions can also be compared against other benchmarks or peer regions.

II3 is available for counties, metro areas, economic development districts, and states.

What is the Data Telling Us?

The index comes with a mapping tool that allows you to quickly view the index headline or any of its components at the state, county, metro, and economic development district levels.

Chart Title: Headline Innovation Index

A map of all counties in the United States uses color gradients to show each county's overall index score. Each county is not labeled with its score, but shows a wide variety of scores across all states, with higher concentrations of high scores the following areas: Hawaii, Seattle/Tacoma, WA, Portland, OR, the San Francisco Bay Area, CA, Southern California, Salt Lake City, UT, Boulder, CO, a few metropolitan areas in Texas, Minneapolis, MN, much of the state of Florida, Atlanta, GA, most of the East Coast between Maine and Maryland. A high concentration of low scores are in Virginia.Source: StatsAmerica

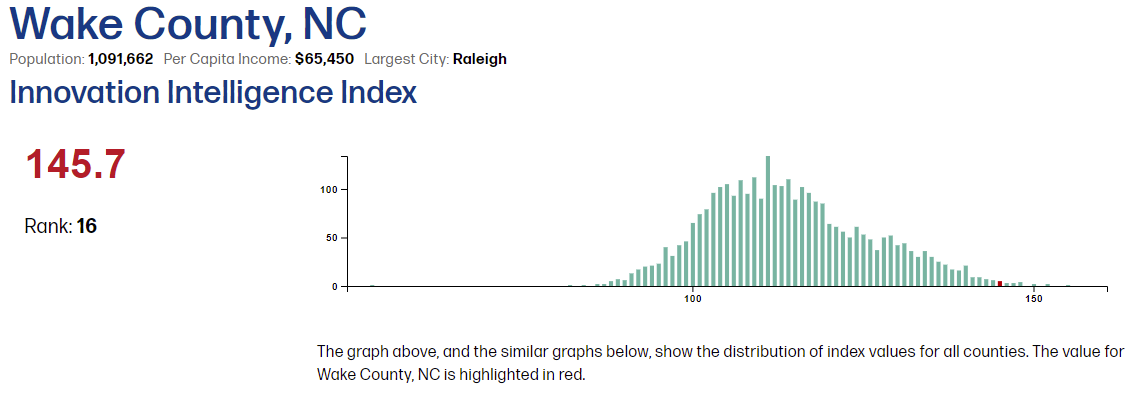
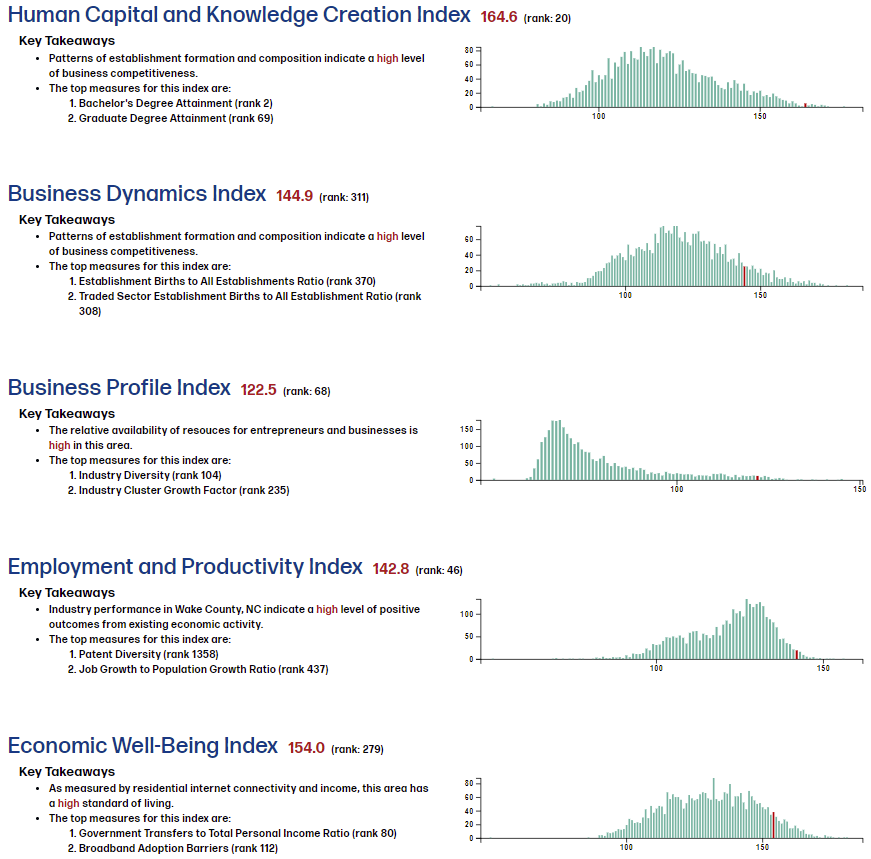
Selecting a particular geography allows you to hone in on more specific data and details related to that region’s level of innovation. In the below example, Wake County, NC, home to Raleigh, is selected. With an innovation index of 145.7, the county is the top 16th county in terms of innovation capacity. Key takeaways for each of the five core indices are concisely summarized, with the county ranking highest on the Human Capital and Knowledge Creation Index.

Column Chart Title: Wake County, North Carolina

Population: 1,091,662
Per Capita Income: $65,450 per year
Largest City: Raleigh

Innovation Intelligence Index: 145.7
Rank: 16

The graph shows the distribution of index values for all counties in North Carolina. The value for Wake County is highlighted in red and is at the top end of the ranking with a higher than average score.

A series of five column charts shows Wake County's score and rank for five specific indexes and key takeaways.

Chart 1: Human Capital and Knowledge Creation Index Score: 164.6
Rank: 20

Key Takeaways: Patterns of establishment formation and composition indicate a high level of business competitiveness. The top measures for this index are: 1) Bachelor's degree attainment (rank 2) and 2) Graduate Degree Attainment (rank 69).

Chart 2: Business Dynamics Index Score: 144.9
Rank: 311

Key Takeaways: Patterns of establishment formation and composition indicate a high level of business competitiveness. The top measures for this index are: 1) Establishment births to all establishments ratio (rank 370) and 2) Traded sector establishment births to all establishment ration (rank 308).

Chart 3: Business Profile Index Score: 122.5
Rank: 68

Key Takeaways: The relative availability of resources for entrepreneurs and businesses is high in this area. The top measures for this index are: 1) Industry diversity (rank 104) and 2) Industry cluster growth factor (rank 235).

Chart 4: Employment and Productivity Index Score: 142.8
Rank: 46

Key Takeaways: Industry performance indicates a high level of positive outcomes from existing economic activity. The top measures for this index are: 1) Patent diversity (rank 1358) and 2) Job growth to population growth ratio (rank 437).

Chart 5: Economic Well-Being Index Score: 154.0
Rank: 279

Key Takeaways: As measured by residential internet connectivity and income, this area has a high standard of living. The top measures for this index are: 1) Government transfers to total personal income ratio (rank 80) and 2) Broadband adoption barriers (rank 112).

Source: StatsAmerica

Why is It Important?

Understanding regional strengths related to innovation and entrepreneurship can help advance local and regional economic development strategies. This tool allows economic developers and other stakeholders to quickly see where their region falls in terms of relative innovation capacity compared to its peers.

Learn more about our Entrepreneurship and Innovation services

Preview Image Source: Adobe Spark and Camoin Associates