- Navigator
- Featured Indicator
- Industry Analytics and Strategy
 The US Census’ American Community Survey tracks geographic mobility (migrations within the US and immigration into the US from abroad) along with the demographics of our migrant population. Explore the data for your region at https://data.census.gov/. Understanding US migration data and demographics can help make workforce attraction efforts more effective.
What is the Data About US Migration Telling Us?
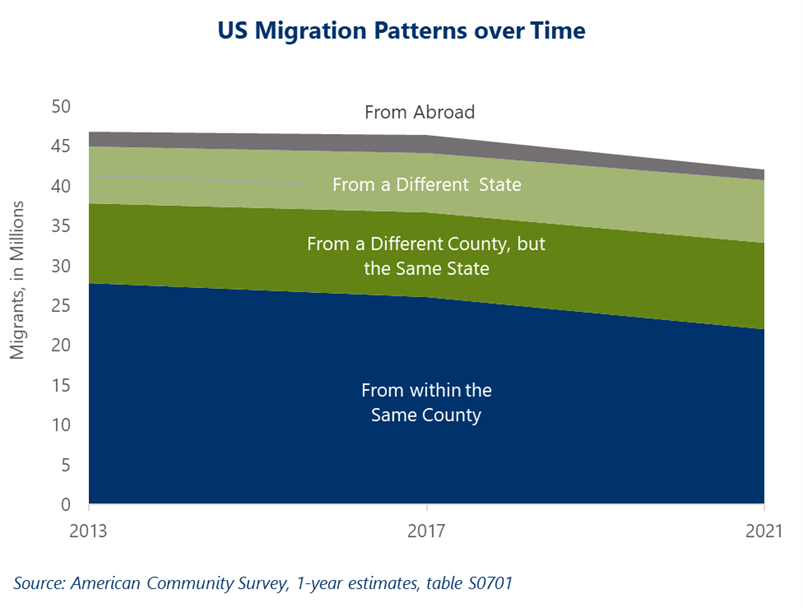
In 2021, 42 million people over one year of age — 12.8% of the total US population — migrated into or within the US. And although there have been a lot of news stories recently talking about people moving to different states for family, work, affordability, or political reasons, our county’s migration numbers have actually been decreasing over time with 4.8 million fewer people migrating within the US in 2021 compared to 2013, a decrease of 10.3%.
Most migrants within the US remained within the same region in 2021:
- 47% of moves were within the same county, a 20.9% decrease over 2013
- 23.1% were within the same state, an 8.4% increase over 2013
- 16.8% migrated to a different state, a 9.7% increase over 2013
Immigrants to the US from other countries totaled only 2.8% of migrants in 2021, a dramatic 29.9% decrease over 2013. In 2021, the average US migrant was:
- Younger: 1% of migrants were between the ages of 25 and 34, compared to a median age of 39.2 for the overall US population. The data shows that younger people are more likely to migrate: 26.6% of the population between the ages of 18 to 24 and 22.5% of the 25 to 34 population migrated in 2021.
- White: 3% of all migrants were White in 2021, followed by Black or African American (13.3%), and Two or more Races (13.2%). However, diverse populations are still more likely to migrate when you look at the percentage of people who were on the move in 2021 within each group’s total population instead of the entire US population: 15.8% of Native Hawaiian and Other Pacific Islanders migrated in 2021, 14.2% of Asians, and 14.1% of Black or African Americans, compared to only 12.4% of Whites.
- A college graduate: 39.8% of migrants had a bachelor’s degree or higher, while 9.3% had less than a high school education. More educated demographics are also slightly more likely to migrate: 13% of the population with a bachelor’s degree and 12.6% of those with a graduate degree migrated in 2021 compared to 10% for high school graduates.
Why Is This Data Important?
Many communities are looking to attract workers as a means of addressing labor force shortages. Attraction is not likely to be an adequate solution on its own given the relatively small numbers of people that migrate, decreasing migration rates, and the fact that the majority of migration happens within the same region.
When workforce attraction efforts are made, they are more likely to be effective when targeted toward the demographics that are most likely to migrate, including younger, white (in terms of migration volume), and more highly educated workers.
In general, workforce attraction should always be paired with other strategies to build and support the existing workforce, including upskilling, graduate retention, providing soft skills training and wraparound supports, and addressing systemic problems that prevent missing workers from participating in the labor force.
Camoin Associates is a national leader in using research and data analysis to help communities and organizations understand where they are now and develop actionable goals designed to get them where they want to be. Learn more about our services.


