
- Navigator
- Prospecting and Business Attraction
 Let’s face it: We’re obsessed with rankings. From sports teams to restaurants, we love to see who comes out on top. In the world of economic development, state business rankings have become the Super Bowl of bragging rights.
CNBC’s annual “Top States for Business” list has become the big kahuna that keeps policymakers, site selectors, and corporate bigwigs on the edge of their seats each year.
For folks in economic development, these rankings can be a double-edged sword. One minute, you’re popping champagne because your state moved up a spot; the next, you’re pulling your hair out trying to explain why you dropped three places.
I saw a LinkedIn post recently from a state leader talking about how they were only three points behind the first-place winner this year, which is truly not a big margin at all, but it does take away the ability to brag (second place doesn’t have quite the same impact as first, of course).
I’ve had other economic development professionals tell me they don’t look at these rankings, and they don’t matter to them. Still, when you look at the marketing materials across state economic development websites, you find the opposite is true: These state business rankings are definitely being used by economic development organizations, corporate executives, and site selection consultants to market and evaluate states.
But here’s the thing: While these rankings might make for splashy headlines, they are also like trying to describe a person using only their SAT score. Sure, it tells you a lot about one aspect of who they are, but does it cover the whole picture? Not even close.
So, what’s an economic development professional, site selection consultant, or corporate executive to do? Ignore the rankings altogether? Hardly. But it’s time we took a hard look at what these numbers really mean, how they shape our strategies, where they fall short, and how they can be useful in site selection and economic development decision-making.
The CNBC Top States for Business rankings have become a key barometer in economic development. At its core, the ranking system is a data-driven attempt to quantify the business climate of all 50 states. The 2024 edition evaluates states across ten key categories, each weighted differently:
These weights aren’t arbitrary. They’re based on how frequently each factor appears in state economic development marketing materials — a clever way to align the rankings with real-world priorities. This approach offers a unique perspective on what’s truly driving business decisions on the ground.
Each category is scored using 128 metrics based on data from authoritative sources, such as the US Census Bureau, the US Bureau of Labor Statistics, and individual state economic development departments.
The weights shifted this year, with infrastructure taking the top spot for the first time since the rankings began in 2007. While workforce remains crucial, it’s no longer the primary factor used by CNBC to rank a state’s economic climate.
The metrics have also changed over the years to reflect emerging trends. This year, new considerations included states’ artificial intelligence readiness and the impact of insurance market challenges in certain states.
Interestingly, CNBC also incorporated data from the Site Selectors Guild this year, focusing on infrastructure metrics like site readiness programs, certified site inventory, and overall investment in site development.
For those of us in the trenches of economic development, understanding these rankings can provide valuable insights into how our states are perceived and where we might focus our efforts for improvement.
For others in site selection or corporate location decision-making, state business rankings will never be the only metric driving their decisions. Still, it can still influence their overall first impression of a state as a viable option for relocation or expansion.
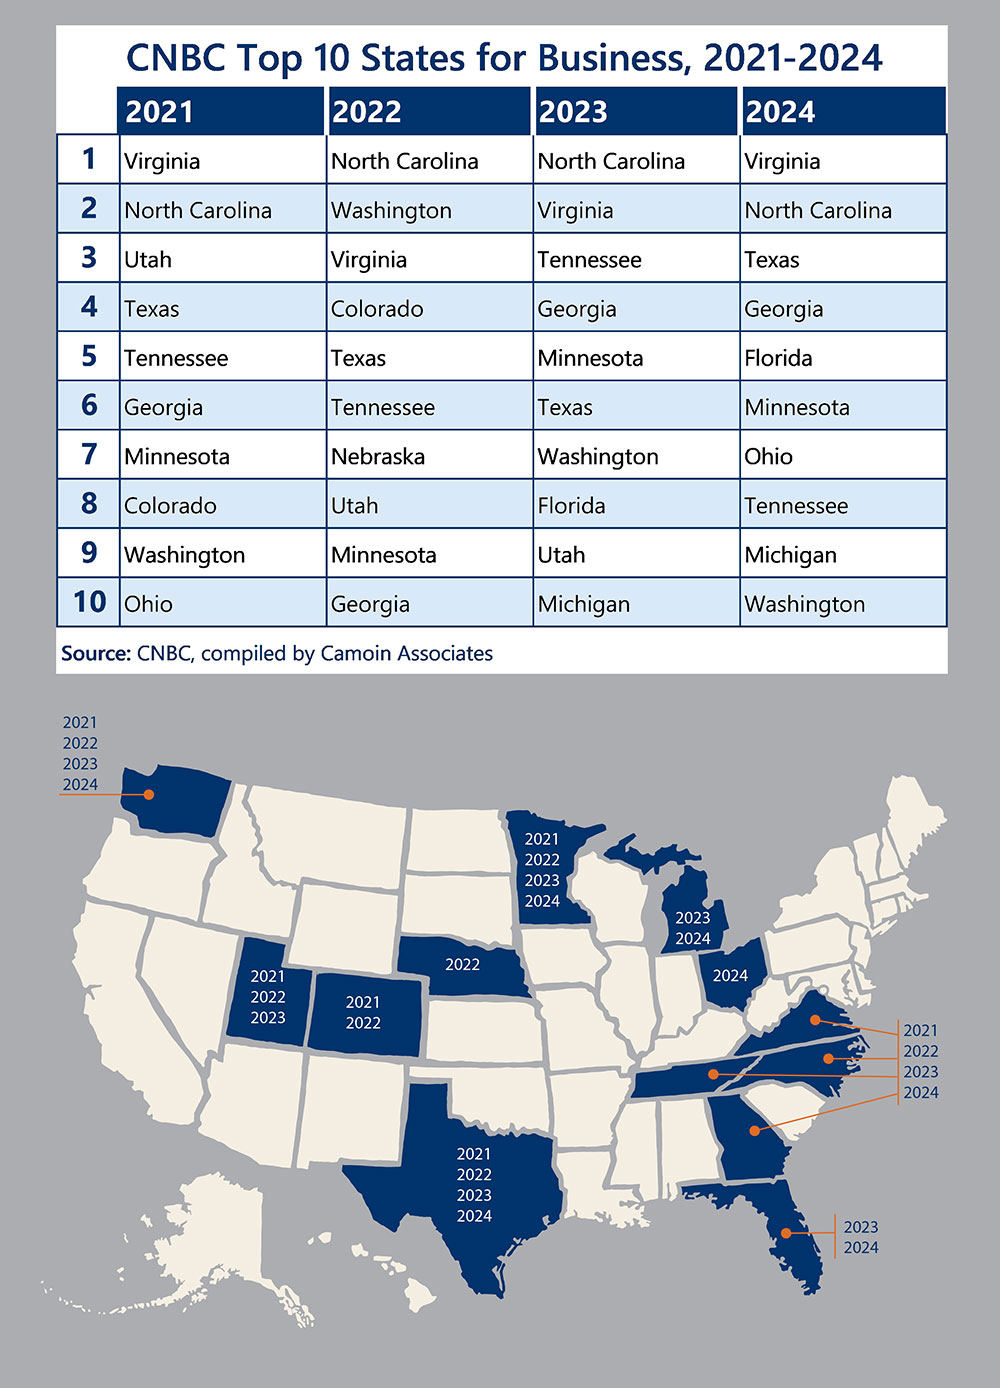
In 2024, Virginia was ranked as the top state for business in the CNBC ranking, attributed to its strong site readiness program and high infrastructure score. Virginia is also often praised for its strong workforce, excellent education system, and business-friendly regulatory environment.
Virginia has consistently performed well on CNBC’s state business rankings over the past few years, consistently appearing in the top three since 2021. This consistency suggests a robust, well-rounded approach to economic development beyond just infrastructure.
North Carolina has long been recognized for its strong economy, access to capital, and technology and innovation ecosystem. It finished first in the rankings in 2022 and 2023 but dropped to #2 in 2024. This indicates that the state may need to bolster its infrastructure and address any gaps identified by the new ranking methodology to regain the top spot.
Texas has moved up three spots into the third position this year, which is no surprise to those familiar with how well the state has done attracting new business investment in recent years. Texas is lauded for its robust infrastructure, strong economy, and relatively low cost of doing business.
Reflecting that success, Site Selection Magazine also ranked Texas as the top state in its 2023 business climate rankings, with Virginia ranked #3. These states have both done excellent work leveraging their strengths to attract major corporate investments and foster economic growth.
Now, in comparison to CNBC’s list, Area Development magazine ranked the following states as their top ten for doing business in November 2023:
There are some similarities between the two lists, as well as some big differences, with several states appearing in one list but not the other.
Area Development’s list has a large concentration of states in the South, which makes logical sense due to the amount of capital investment we see moving into the Southern market, the economic growth of those states and the region, and the general feeling of business friendliness. But for CNBC’s ranking system, it isn’t that simple or obvious.
Each ranking system has a different algorithm and methodology, which is interesting to look at and consider, especially when these rankings carry as much weight as they do in today’s market.
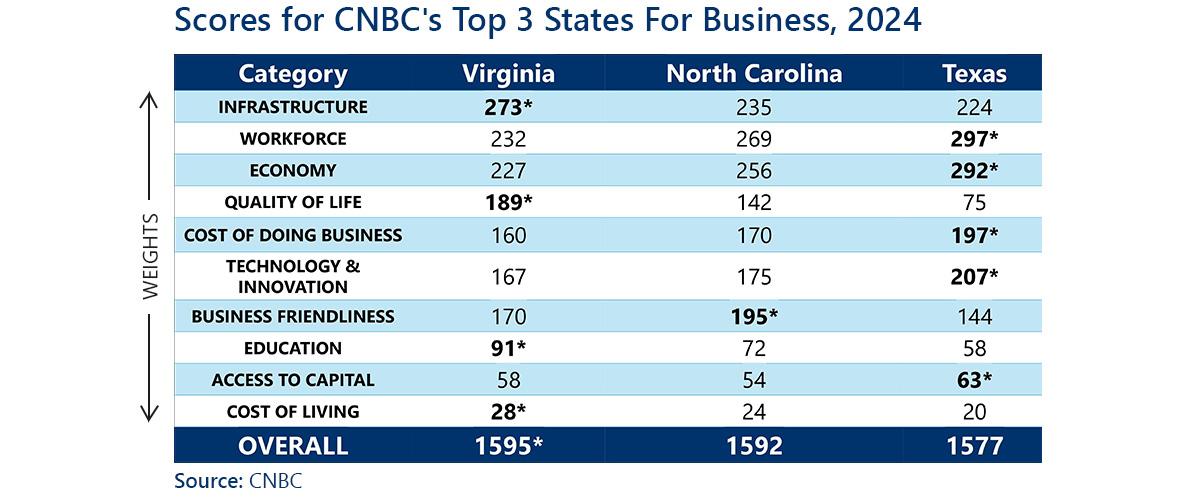
These scores show intense competition among states to be the most attractive for businesses. Virginia claimed the top spot with 1,595 points, narrowly beating North Carolina with 1,592 points and Texas with 1,577 points.
Texas excelled in several key categories:
This makes Texas a powerhouse for economic opportunities and innovation, with a strong workforce and business-friendly policies. However, Texas scored lower in quality of life and education.
Virginia’s strengths were in:
This creates a balanced and sustainable environment for businesses and their employees. Virginia’s high infrastructure score suggests it is well-prepared to support growth.
North Carolina’s key assets were:
This makes it appealing for businesses seeking a supportive regulatory environment and a reliable labor pool. However, North Carolina’s lower score in access to capital could be a limitation.
The razor-thin margin between these top three states emphasizes the importance of tailoring economic development strategies to leverage each state’s strengths while addressing areas needing improvement.
While the CNBC Top States for Business rankings hold significant sway in our field, it’s crucial to approach them with a discerning eye. Let’s explore some of the challenges these rankings face:
Overall, CNBC’s rankings are the most comprehensive and well-researched on the market, and they do provide value to economic development professionals, site consultants, and corporate executives considering expansion or relocation. They offer a broad snapshot of a state’s business climate and can spark important conversations. However, they’re just one piece of a much larger puzzle.
When working with site selectors or corporate decision-makers, it’s crucial to emphasize that these state business rankings aren’t the be-all and end-all. They’re a starting point, not the finish line. The best locations for expansion or relocation will always depend on a company’s specific needs, goals, and industry.
In essence, while the CNBC rankings offer a useful bird’s-eye view, the real insights often lie in the details — the local workforce, specific infrastructure, targeted incentives, and the many other factors that make a location truly right for a particular business.
While state business rankings offer a quick snapshot, perceptive economic developers know there’s more to the story. Let’s dive into some key factors that often fly under the radar:
But here’s where it gets interesting — some states are punching above their weight class, regardless of their overall ranking:
These success stories underscore a crucial point: It’s not about playing to the state business rankings; it’s about playing to your strengths.
Different industries have different needs:
And let’s not forget regional variations within states:
The key takeaway? Economic development isn’t a one-size-fits-all game. It’s about understanding and leveraging your unique advantages to cultivate industry clusters and develop competitive niches.
This nuanced approach moves us beyond the simplistic chase for good rankings. Instead, it focuses on crafting sustainable, long-term growth strategies tailored to local strengths and opportunities. That’s the kind of sophisticated economic development that truly moves the needle.
While traditional state business rankings offer valuable insights, savvy economic developers are expanding their toolkit. Let’s explore some alternative approaches to sizing up and promoting your state’s business environment:
Included in a few of the strategic economic development plans that our Strategic Planning Team has conducted for statewide organizations, including the State of Utah and the State of Rhode Island, is a framework consisting of six different categories, referred to as the “6 I’s,” which ranks states by the key fundamentals of economic prosperity:
Our staff ranks these categories using specific, proprietary metrics and compares them to all other states across the country to understand where a state stands, its strengths, and its weaknesses, allowing us to analyze the fundamentals of prosperity comprehensively.
Camoin Associates has conducted countless target industry studies, cluster analyses, and geographic competitiveness assessments, allowing our clients to gain actionable insights as part of strategic plans, comprehensive economic development strategies, or through individual studies and assessments.
> Learn more about our Industry Analytics and Strategy Services.
You can paint a more nuanced, actionable picture of a state’s business climate by embracing these alternative approaches. This allows for laser-focused strategies that go beyond what traditional rankings can offer. Moreover, these fresh perspectives can provide compelling narratives for business attraction. They highlight unique strengths and opportunities that might get lost in broader rankings. They also offer a framework for continuous improvement, ensuring our economic development initiatives stay in tune with the evolving needs of businesses and workers.
Ultimately, it’s about telling a richer, more accurate story of what your state offers. That’s how you stand out in a crowded field and attract the economic growth that truly matters.
Do you want to discover your state or region’s unique economic development strengths and obtain actionable recommendations on how to maximize and market those strengths to attract new business investment? Camoin Associates can help.
Learn more about our Industry Analytics and Strategy Services
Learn more about our Strategic Planning Services
Learn more about our Workforce Development and Talent Attraction Services
Learn more about our Prospecting and Business Attraction Services

Real Estate Development and Housing
In 2025, the City of Albany, NY, partnered with Camoin Associates to complete a citywide housing audit that offers lessons for other mid-sized, moderate-growth cities about how to align housing policy with local economic realities while advancing equitable outcomes.

Industry Analytics and Strategy

Entrepreneurship and Innovation
Your resource for understanding today and looking toward tomorrow