
- Navigator
- Real Estate Development and Housing
- Retail, Services, and Accommodations
 Have you noticed the vacant retail spaces around town? Have these storefronts and buildings been empty for months? Or years? By understanding retail trade areas and the retail gap, economic development organizations can assist stakeholders in identifying the best-suited industries and retailers to fill these spaces and ultimately revitalize the neighborhood.
These retail vacancies did not happen overnight. According to Morgan Stanley, from 1995 to 2021, more stores closed each year than opened due to the rising popularity of e-commerce and changing demographics, creating a 25-year-long “retail apocalypse.”
The bump in retail sales due to “revenge” spending and pent-up demand after COVID-19 lockdowns are largely over, and today’s retailer is grappling with shifts in pre-pandemic work patterns, higher labor costs, higher rent, and higher interest rates.
The main question for economic development organizations (EDOs) is how to identify the right tenants to fill these spaces.
The solution lies in understanding what makes your neighborhood unique: Who are your consumers, where are they coming from, what retail is missing, and whom does your area compete with?
In essence, look at empty lots through the eyes of a potential retailer, understand your retail trade area, and perform a retail gap analysis to pinpoint the opportunities that fit within the community’s unique demographic and economic profile.
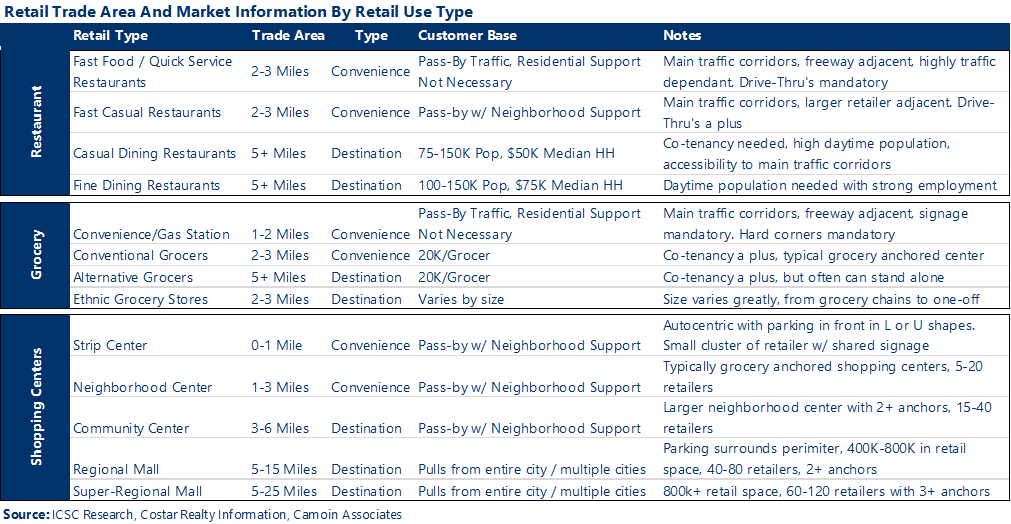
A retail trade area is the geographic region from which retailers draw their customers. There are two broad categories of retailers, convenience, and destination, which have different needs and focus on different ways of attracting customers.
These stores have small trade areas, tend to have a smaller retail footprint, are auto-centric, and cater to the needs of pass-by traffic.
Their customers don’t necessarily live in the area but are traveling along major corridors, ideally at the intersection of two major roads.
Customers do not purposely consume at these locations and will go to wherever is closest or most noticeable, so retailers in this category tend to have many locations.
Features:
 Examples include:
These stores have larger trade areas and depend on the incomes of the surrounding communities for support. Destination retailers sell unique products and experiences with personal service, knowledgeable staff, and relationship selling.
These shops tend to cluster to create a dynamic shopping experience. They will often be represented by a business improvement district, serving in a promotional role on behalf of the merchants.
Most shopping centers will have destination retailers that depend on the income and spending of local residents with name brands that cannot be easily substituted or offer a unique experience. Items are infrequently purchased or require a reservation, the opposite of convenience. These retailers adjust to and reflect the communities they serve.
Features:
 Examples include:
Retailers fall into these two broad categories based on how they get their customers and the goods and services they provide. Convenience retailers sell commodity products and depend more on street traffic than destination retailers, which pull from the surrounding area and sell unique goods or offer specialized services.
Below is a table summarizing restaurants, grocery stores, and shopping centers by their trade area.
Once the retail trade area or retailer type has been identified, demographics and spending data can be used to determine this area’s existing retail sales (“supply”) and compare them to the estimated retail spending of the residents living within the trade area (“demand”).
The difference between supply and demand is the retail gap, which can be positive or negative.
More Demand / Less Supply = Sales Leakage
When the demand (spending by trade area residents) for goods or services is greater than sales at local trade area businesses, sales are said to “leak” out of the trade area, creating a positive retail gap (i.e., sales leakage).
Less Demand / More Supply = Sales Surplus
Conversely, if the supply of goods sold (local trade area sales) exceeds trade area demand (spending by trade area residents), it is assumed that nonresidents are coming into the trade area and spending money, creating a negative retail gap (i.e., sales surplus).
Below is an example of a retail gap analysis for a trade area with a seven-minute drive time (2-3-mile radius). It shows sales leakage and surplus at the six-digit NAICS code level, which is compared to the average sales at a regional level to estimate the number of supportable businesses within this seven-mile drive-time trade area.
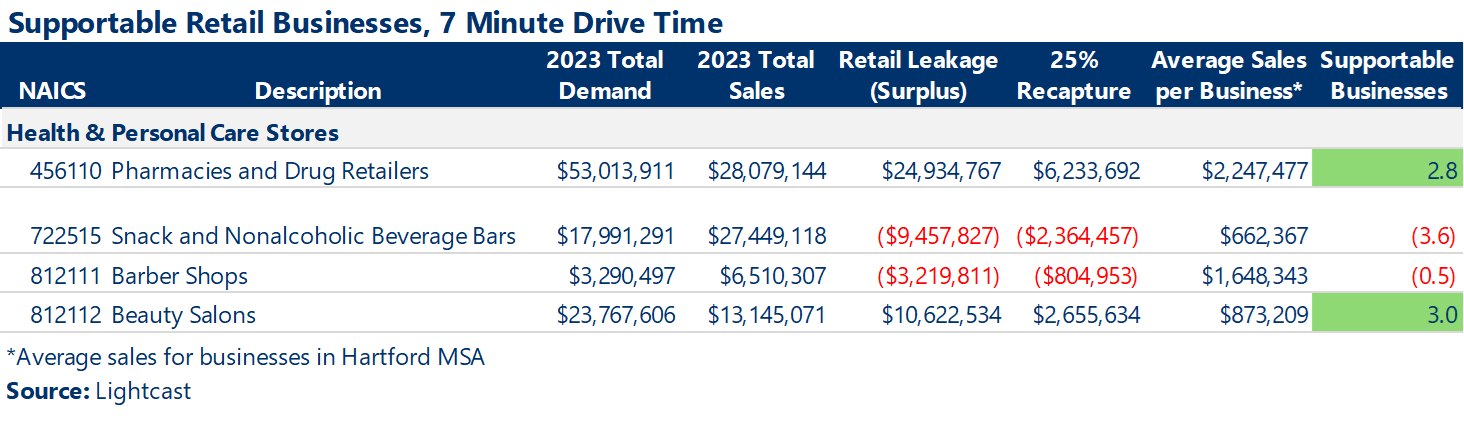
In the example above, 456110-Pharmacies and Drug Retailers is leaking, with nearly $25 million being spent annually outside of the trade area. This means local residents routinely drive more than seven minutes to get their prescriptions filled. Based on the older population in this area and the sales needed to support a pharmacy ($2.2 million), there is room for 2.8 additional pharmacies or drugstore retailers to open.
Conversely, 722515-Snack and Nonalcoholic Beverage Bars (convenience stores/mini-marts) is in surplus. The existing demographics do not support this retail use, and stores of this type have to rely on people from outside the neighborhood to stay in business. Luckily, this trade area contains the intersection of several major roadways with high traffic counts (20,000+ per day), so the pass-by traffic is sufficient to support the existing retailers that occupy these intersections.
Aging demographics are also at play in this trade area when determining the demand for 812111-Barber Shops versus the demand for 812112-Beauty Salons. Women tend to live longer, so as the population continues to age, there will be more women than men, meaning a growing demand for three additional beauty salons catering mostly to women.
At the same time, a barbershop is likely to close in this trade area in the near future due to a lack of customers. Beauty salons and barber shops are destination retailers that pull from the local community and have a loyal and consistent customer base.
In skilled hands, a retail trade area and gap analysis can help tell your retail story, identify areas of growth, and address areas of future concern.
Is it time for a check-up?
Camoin Associates provides a comprehensive range of economic development consulting services, including real estate land use compatibility studies, business retention and attraction strategies, stakeholder engagement, and industry data analytics. These services are designed to support business improvement districts, economic development organizations, and nonprofits in navigating and adapting to the evolving retail landscape.

Real Estate Development and Housing
Ready to move your community forward? Discover how tailored market analysis and strategic public investments can unlock new development.

Industry Analytics and Strategy

Industry Analytics and Strategy
Your resource for understanding today and looking toward tomorrow