
- Navigator
- Featured Indicator
- Industry Analytics and Strategy
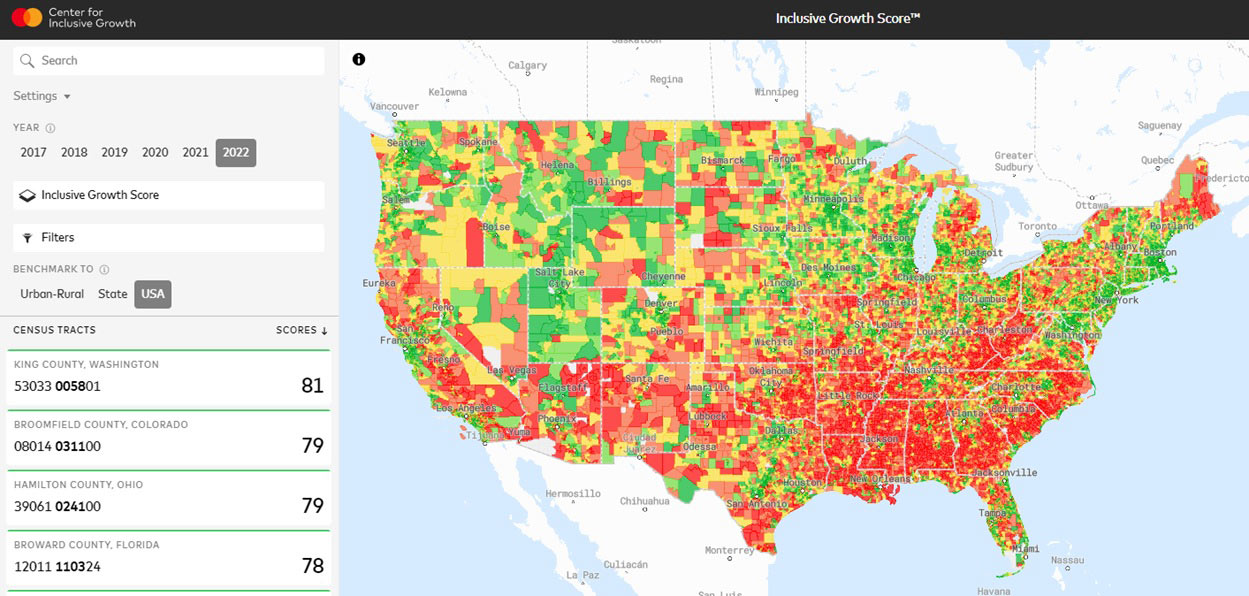
 With the goal of advancing equitable and sustainable economic growth, the Mastercard Center for Inclusive Growth has developed the interactive Inclusive Growth Score tool, useful for reviewing, analyzing, and comparing the social and economic profiles of communities at the neighborhood level.
Comprised of 18 separate data measures, the index is designed to reflect each neighborhood’s potential for meeting the needs of local residents. It also provides a baseline from which to understand change over time as investments start to flow. Examples of the metrics used to determine communities’ Inclusive Growth Score include the percentage of affordable housing, growth in small business loans, growth in spending, and early education enrollment. Separate scores for both inclusion and growth can be viewed and compared based on a ranking at the national level, within the same state, or among areas with a similar degree of urbanization.
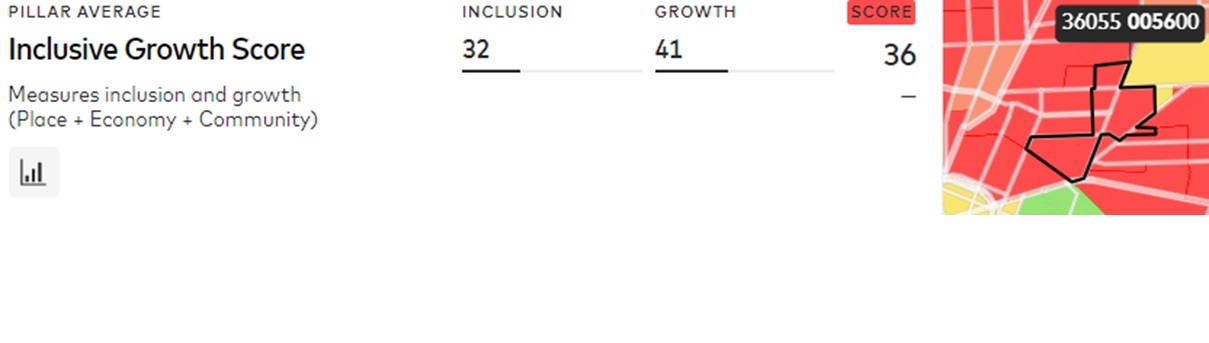
 Within each of the three major components of Place, Economy, and Community are six individual metrics measuring inclusion (e.g., housing affordability, minority/women-owned businesses, and Gini Coefficient) and growth (e.g., changes in population, small business loans, and spending per capita). These metrics are first merged into a single value for the major components (Place, Economy, and Community) and those three measures are, in turn, joined to create an overall Inclusive Growth Score for each community.
The value of these measures is illustrated in an example provided by the Mastercard Center in which the data disproved perceptions that high poverty rates in a neighborhood in Erie, PA, translate into weak market demand for a grocery store. Analysis of the neighborhood’s Inclusive Growth Score showed that the neighborhood’s commercial diversity, the growing number of small business loans and per capita spending, as well as ample affordable housing, and low commute times all pointed to a strong potential for increased investment.
By selecting a specific community, the tool provides users with the ability to download a report, including the overall index value along with measures for the three major components and the 18 underlying data measures.
The map-based interface also lets users drill down through the constituent metrics. As an example, a particular census tract in Rochester, NY, registering an overall Inclusive Growth Score of only 36 (on a scale from 1 to 100) may initially appear to hold little opportunity for investment.
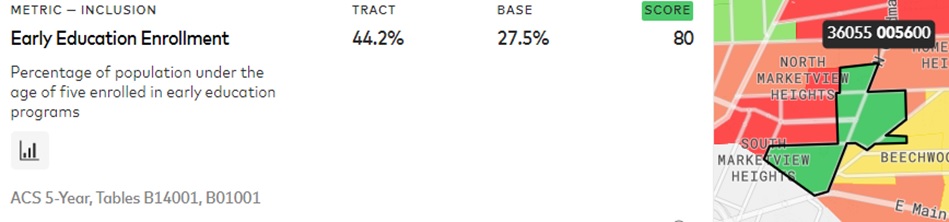
A deeper dive, however, shows several positive indicators which could signal the likely success of specific types of investments. Among these is the strong score in Early Education Enrollment.
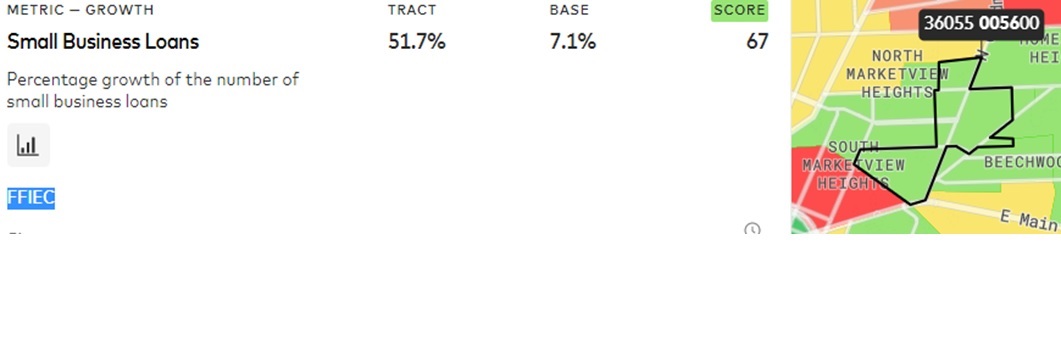
 And the strong growth in small business loans.
 Using the Inclusive Growth Score tool, users are able to gain a more nuanced view of communities and identify specific locations where real opportunities might otherwise be eclipsed by initial impressions or more generalized data measures.
Finally, as the tool is updated annually, it also provides a view over time, illustrating the evolution of our neighborhoods and tracking the impact of prior investments.
Camoin Associates is a national leader in using research and data analysis to help communities and organizations understand where they are now and develop actionable, equitable goals designed to get them where they want to be.

Real Estate Development and Housing
In 2025, the City of Albany, NY, partnered with Camoin Associates to complete a citywide housing audit that offers lessons for other mid-sized, moderate-growth cities about how to align housing policy with local economic realities while advancing equitable outcomes.

Industry Analytics and Strategy

Entrepreneurship and Innovation
Your resource for understanding today and looking toward tomorrow