


- Navigator
- Expansion Solutions
- Arts, Entertainment, Recreation, and Events
- Retail, Services, and Accommodations
- Industry Analytics and Strategy
 This article was originally published in the September/October 2023 issue of Expansion Solutions Magazine.
Outdoor recreation is a critical component of local and regional economies across the US. This includes rural areas as well as densely developed urban areas. It contributes more to the country’s gross domestic product (GDP) than oil, gas, and mining combined and provides important amenities for residents and workers, contributes to healthy communities, helps protect the environment, and provides opportunities for businesses across multiple sectors, from services and manufacturing to retail.
Like most sectors, the outdoor recreation economy was impacted by COVID-19. Employment within the sector decreased by over 10% from 2019-2021 and sales decreased by approximately 16% from 2019-2020. It has since experienced recovery.
This article examines recent trends, opportunities, challenges, and successes in the US outdoor recreation sector and offers guidance to help economic developers grow their outdoor recreation economy.
For the purposes of this article, our definition of outdoor recreation includes direct outdoor recreation as well as highly related manufacturing, sellers, and transportation. For the full list of sectors included in this analysis, see Table 1 at the end of this article.
In 2022, there were an estimated 2,964,703 jobs in the outdoor recreation economy in the US. As shown in Figure 1, attractions and activities jobs accounted for more than half of outdoor recreation employment, and wholesale/retail/rental jobs accounted for more than one quarter. Outdoor recreation-related manufacturing accounted for 6% of the jobs and transportation, such as scenic sightseeing jobs, only accounted for 1%.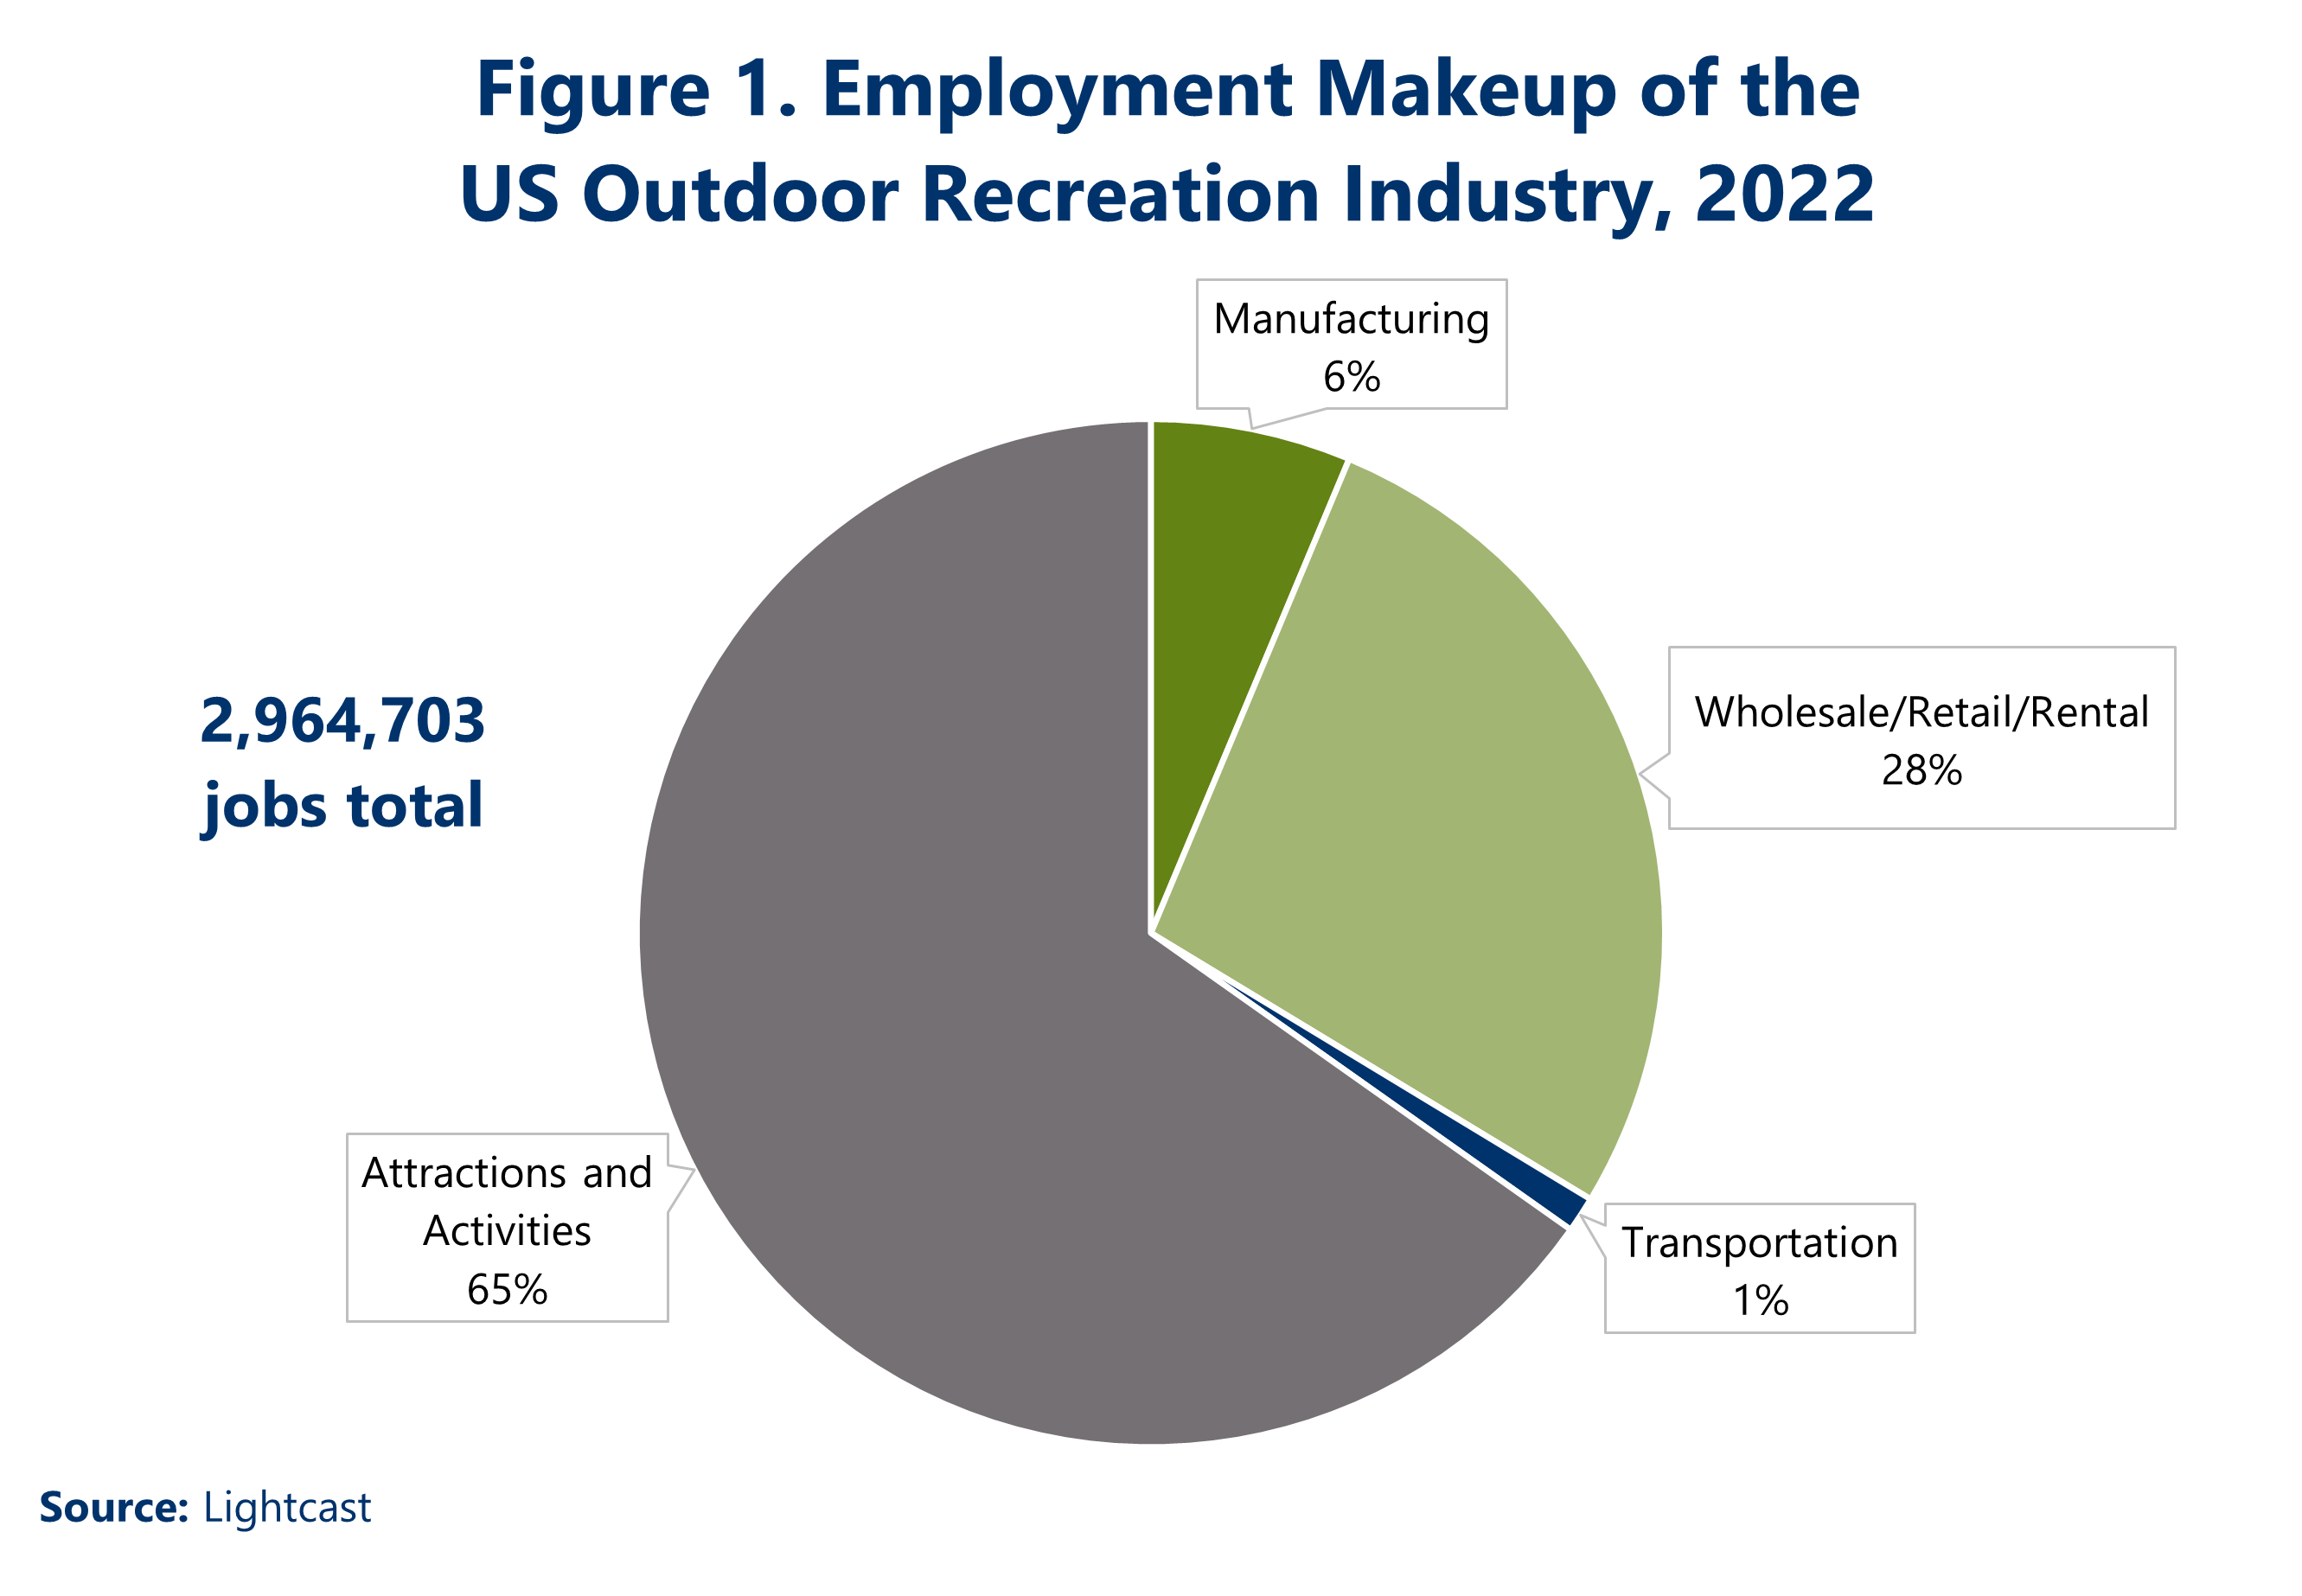
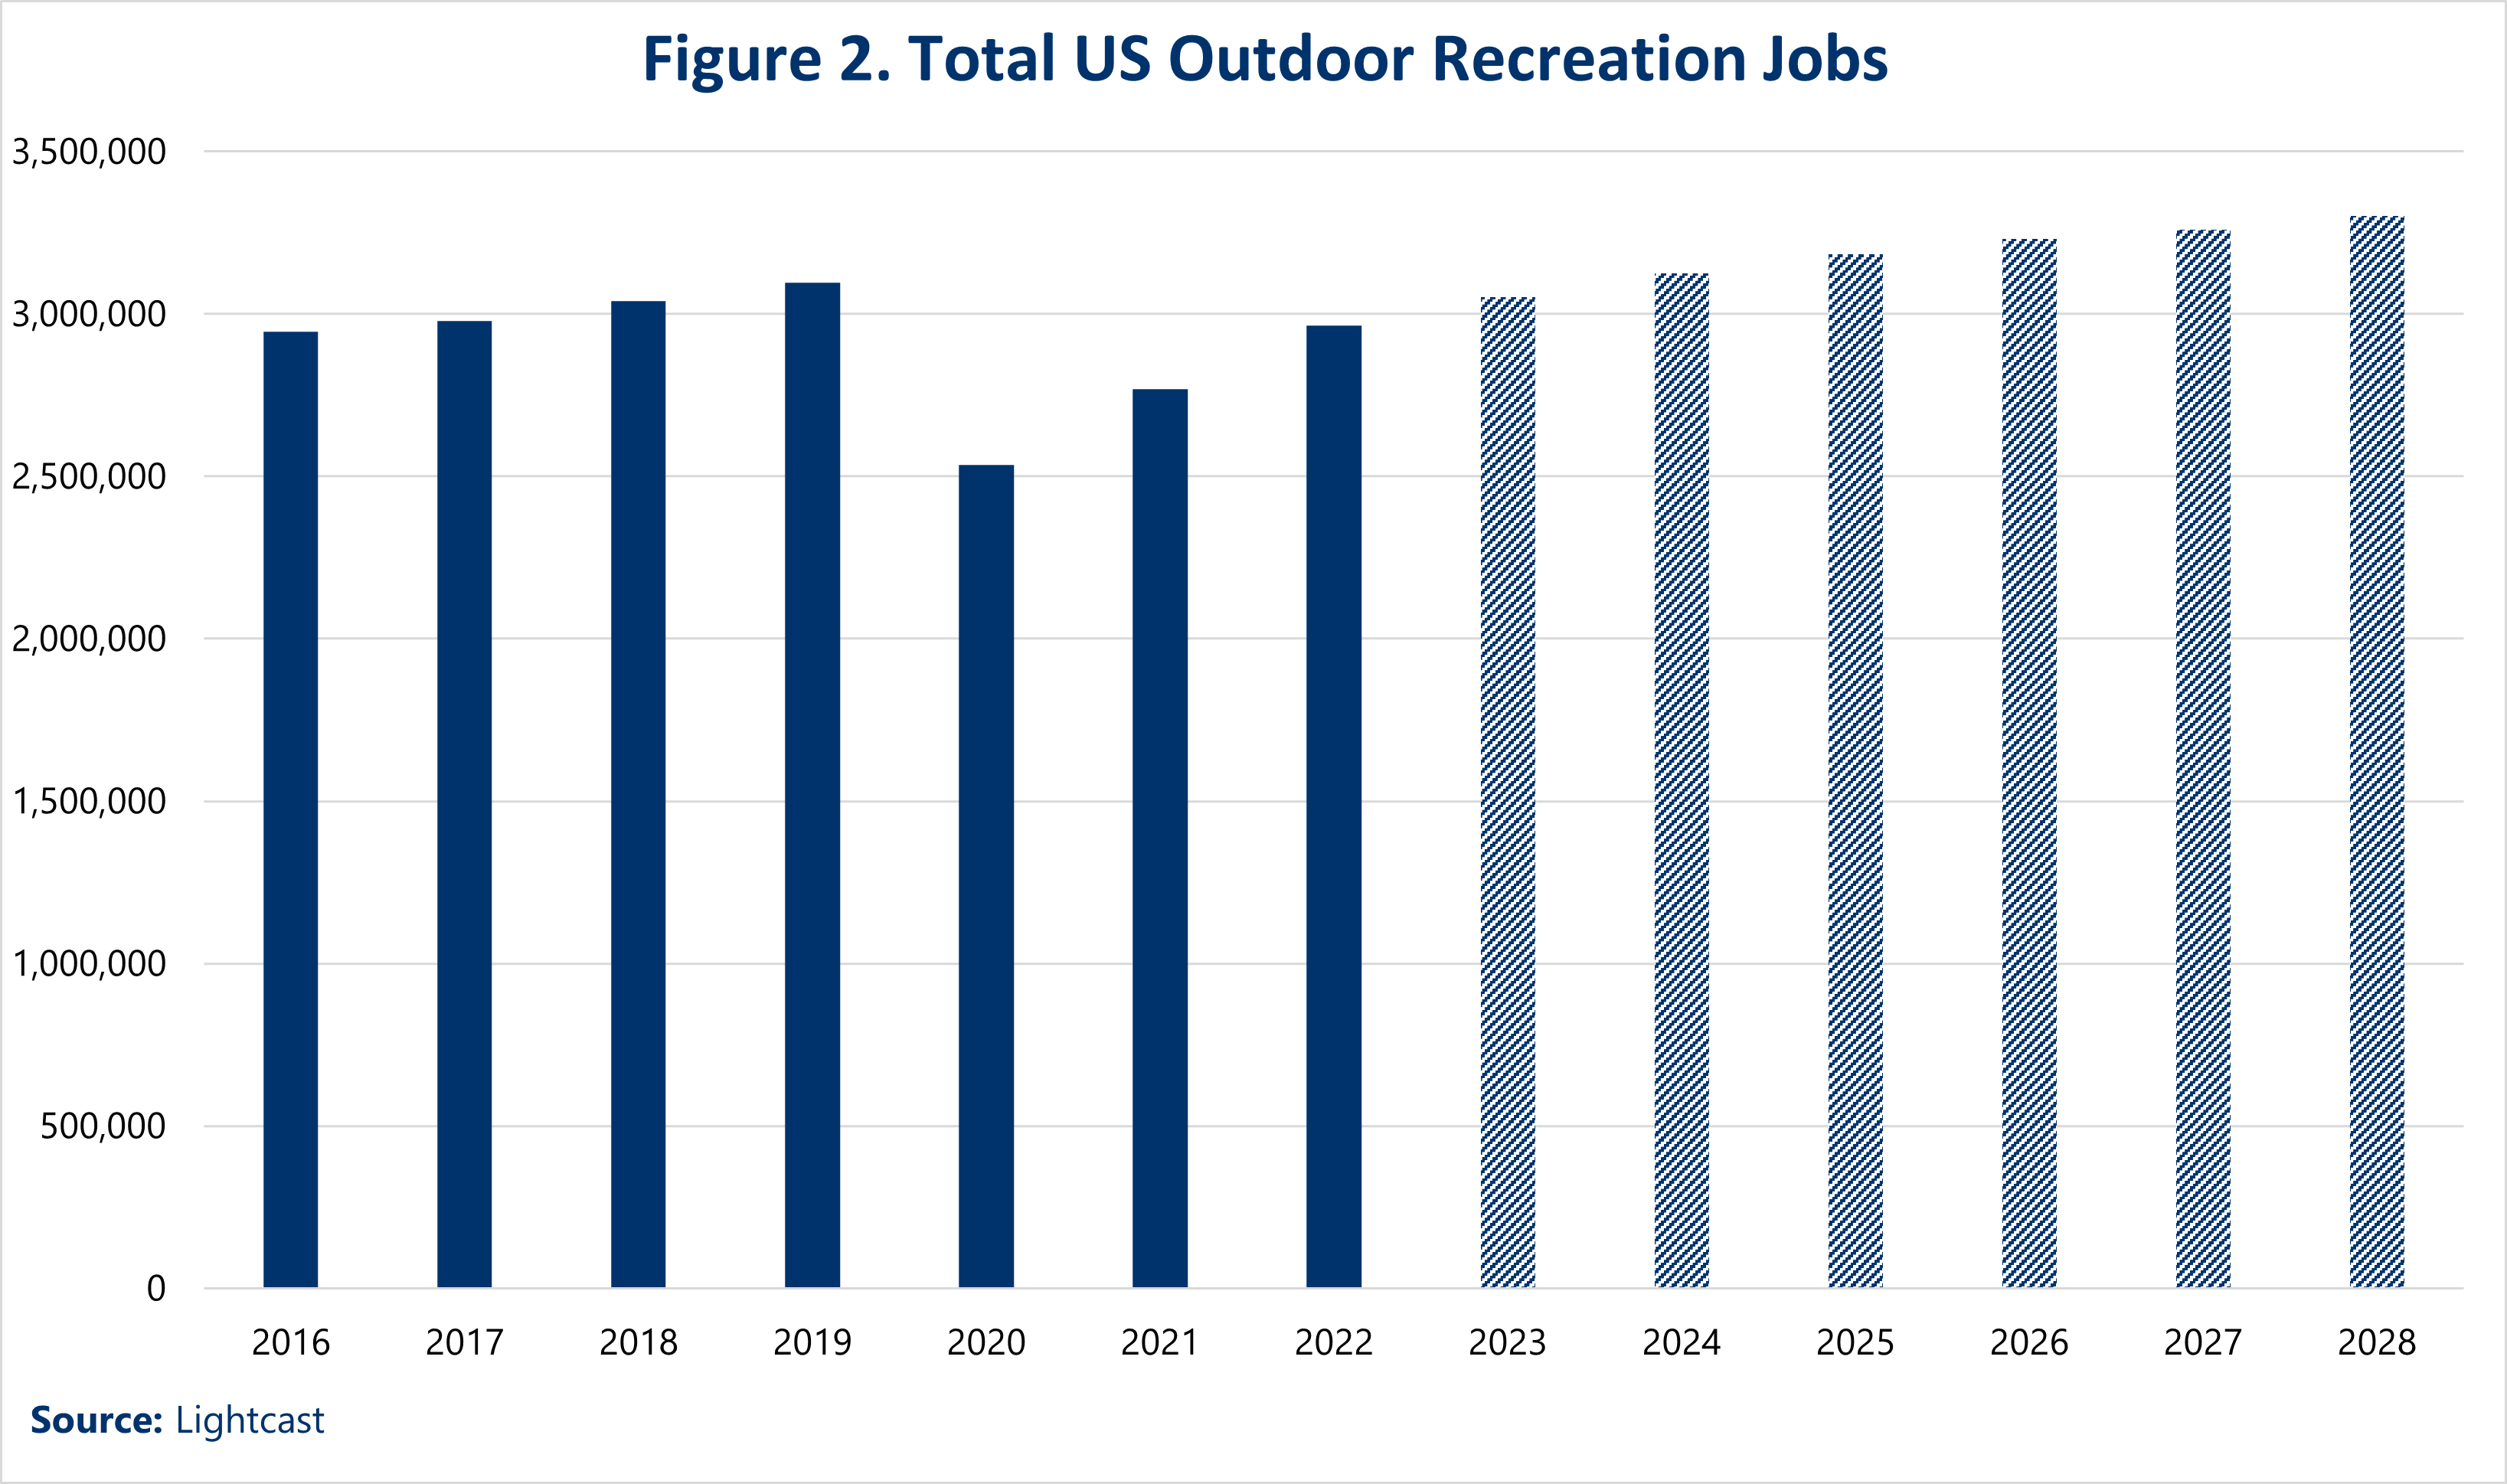
During the COVID-19 pandemic, employment in the outdoor recreation sector dropped from 3.1 million to 2.77 million, a more than 10% decrease from 2019-2021.
As the world recovers from COVID-19, employment is on the path to recovery as well. From 2021-2022, employment increased by over 7%. This is greater than pre-pandemic rates, which were 5.16% from 2016-2019. Employment has not returned to the pre-pandemic figure of 3.1 million, but it is forecasted to reach 3.12 million in 2024 and continue growing, exceeding past employment numbers in the sector (see Figure 2).
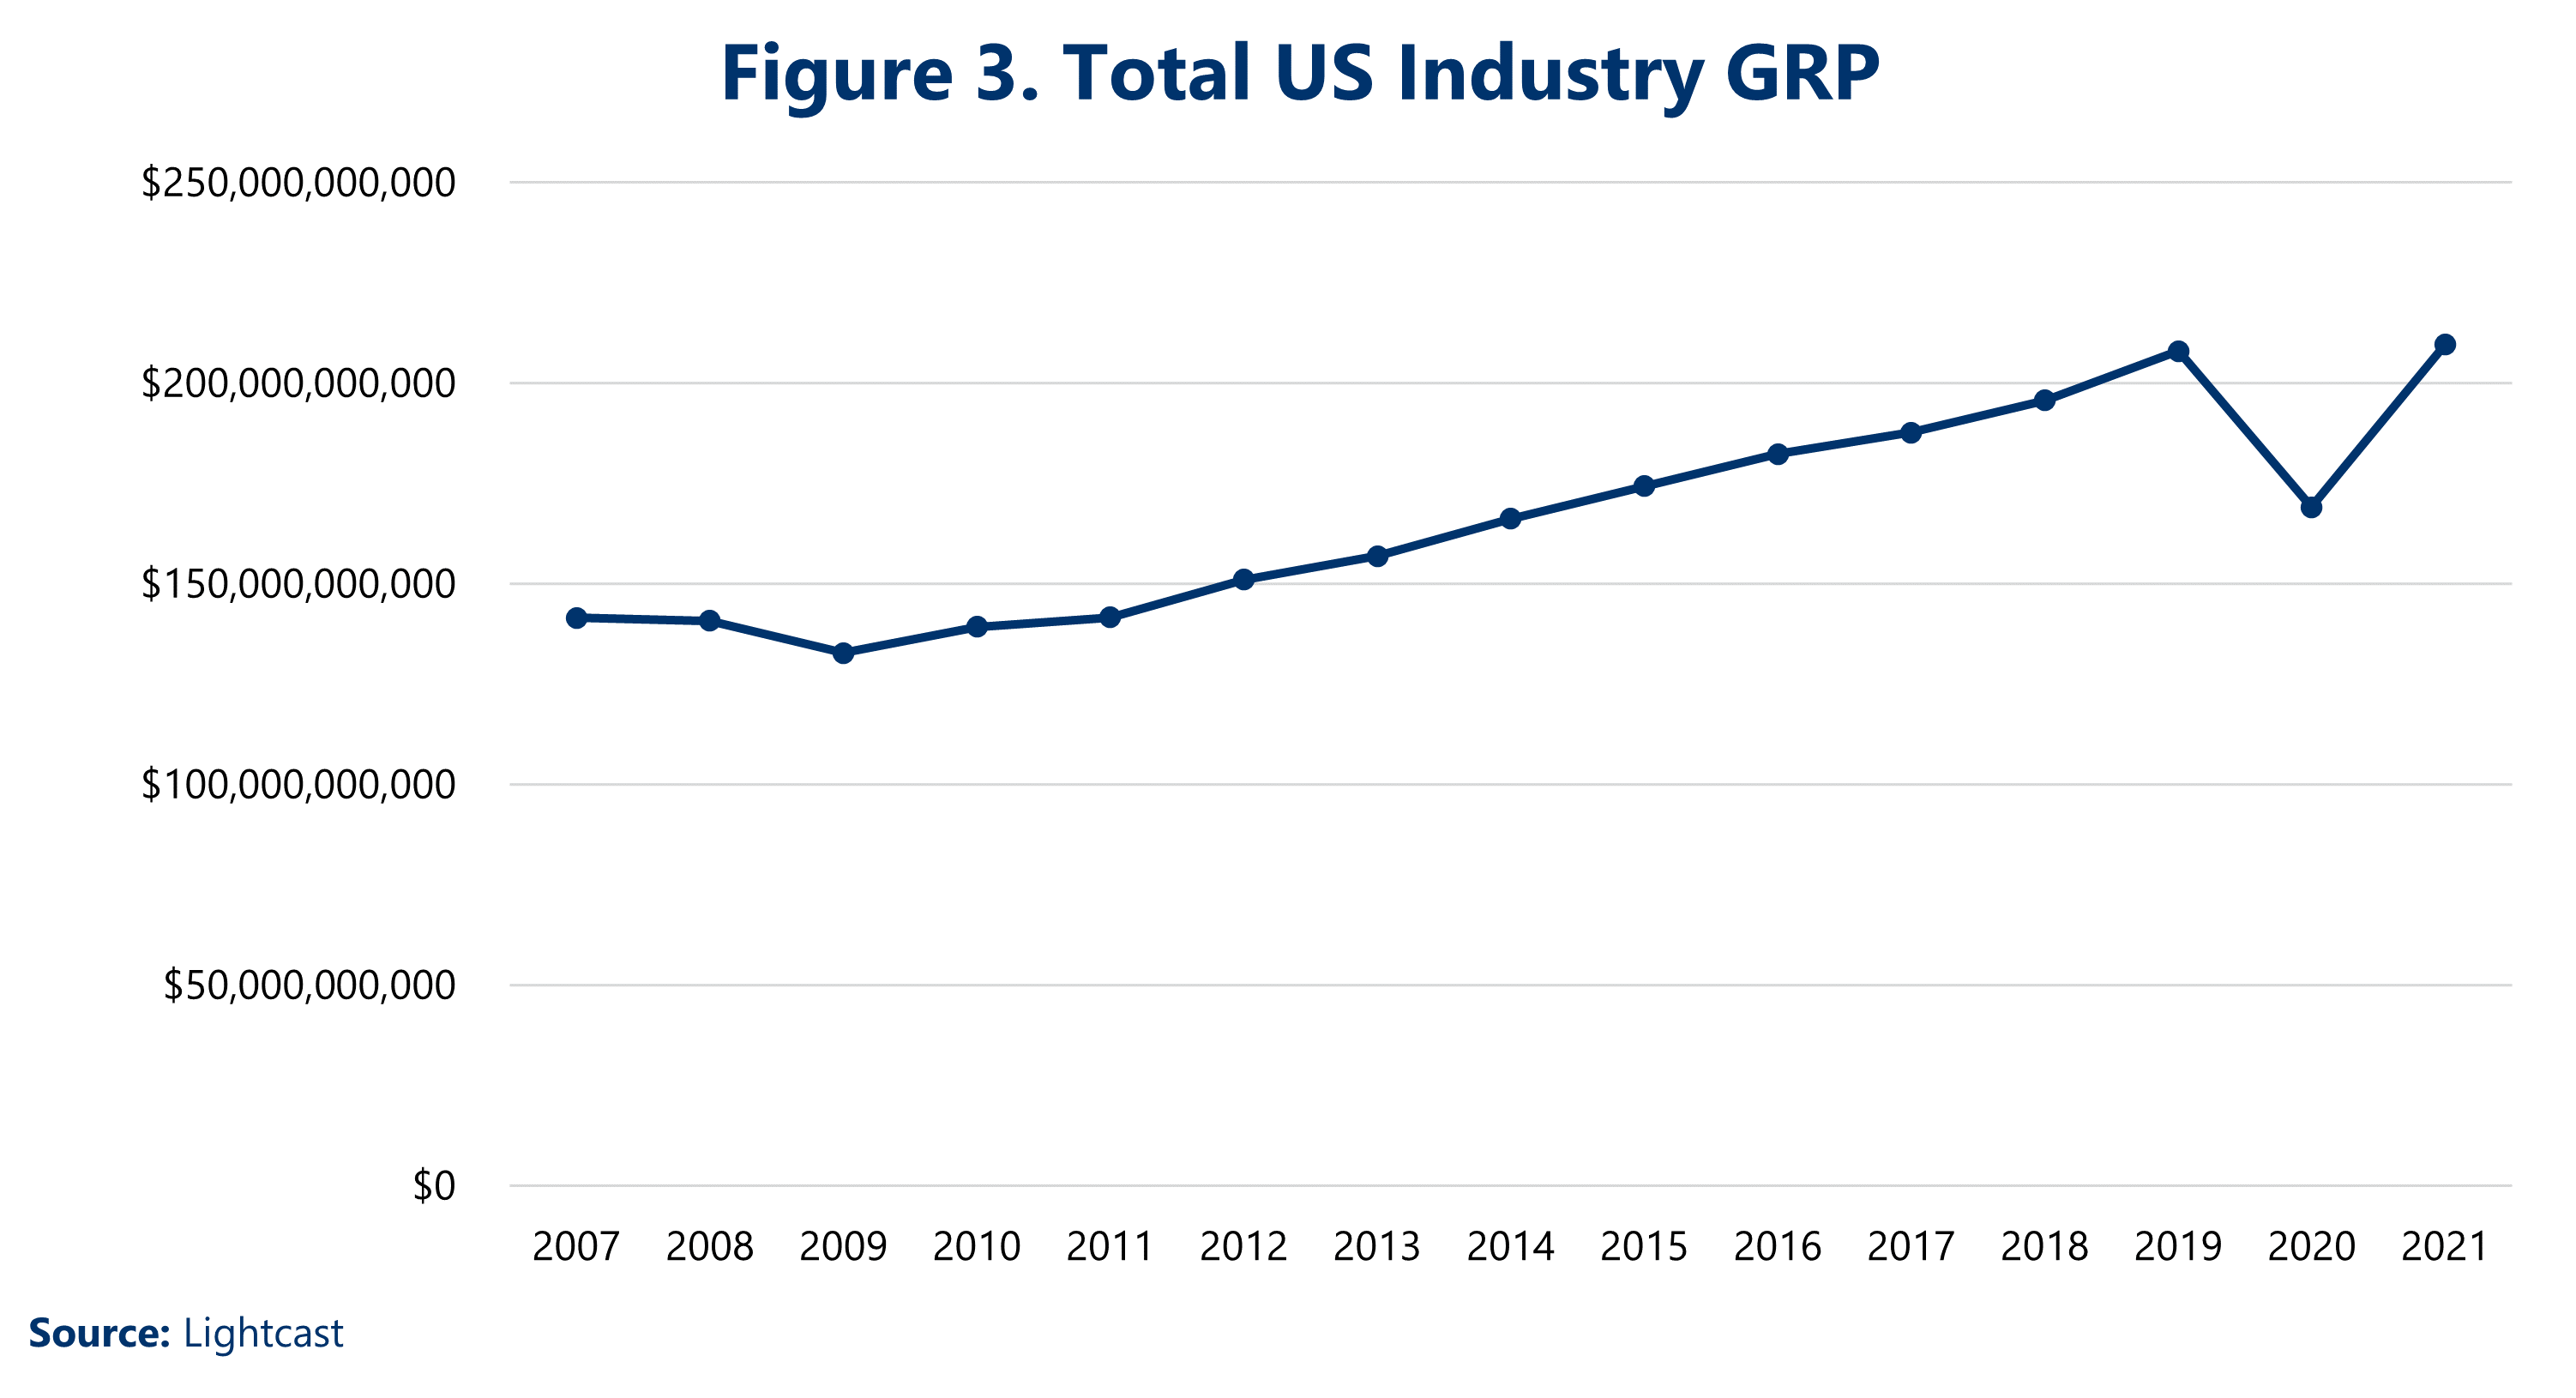
 Gross regional product (GRP), which measures total economic output, has steadily increased by $68.07 billion in the US outdoor recreation sector since 2007, with the only significant drop from 2019-2020. In 2021, the outdoor recreation GRP was already back on track, and the trajectory seems largely unharmed by the pandemic.
 Revenue in the US outdoor recreation industry has been on a steady incline since the 2008 recession. Despite a 16% dip in sales in 2020, revenue shot back up to pre-pandemic levels in 2023 and is projected to continue that steady growth for at least the next five years.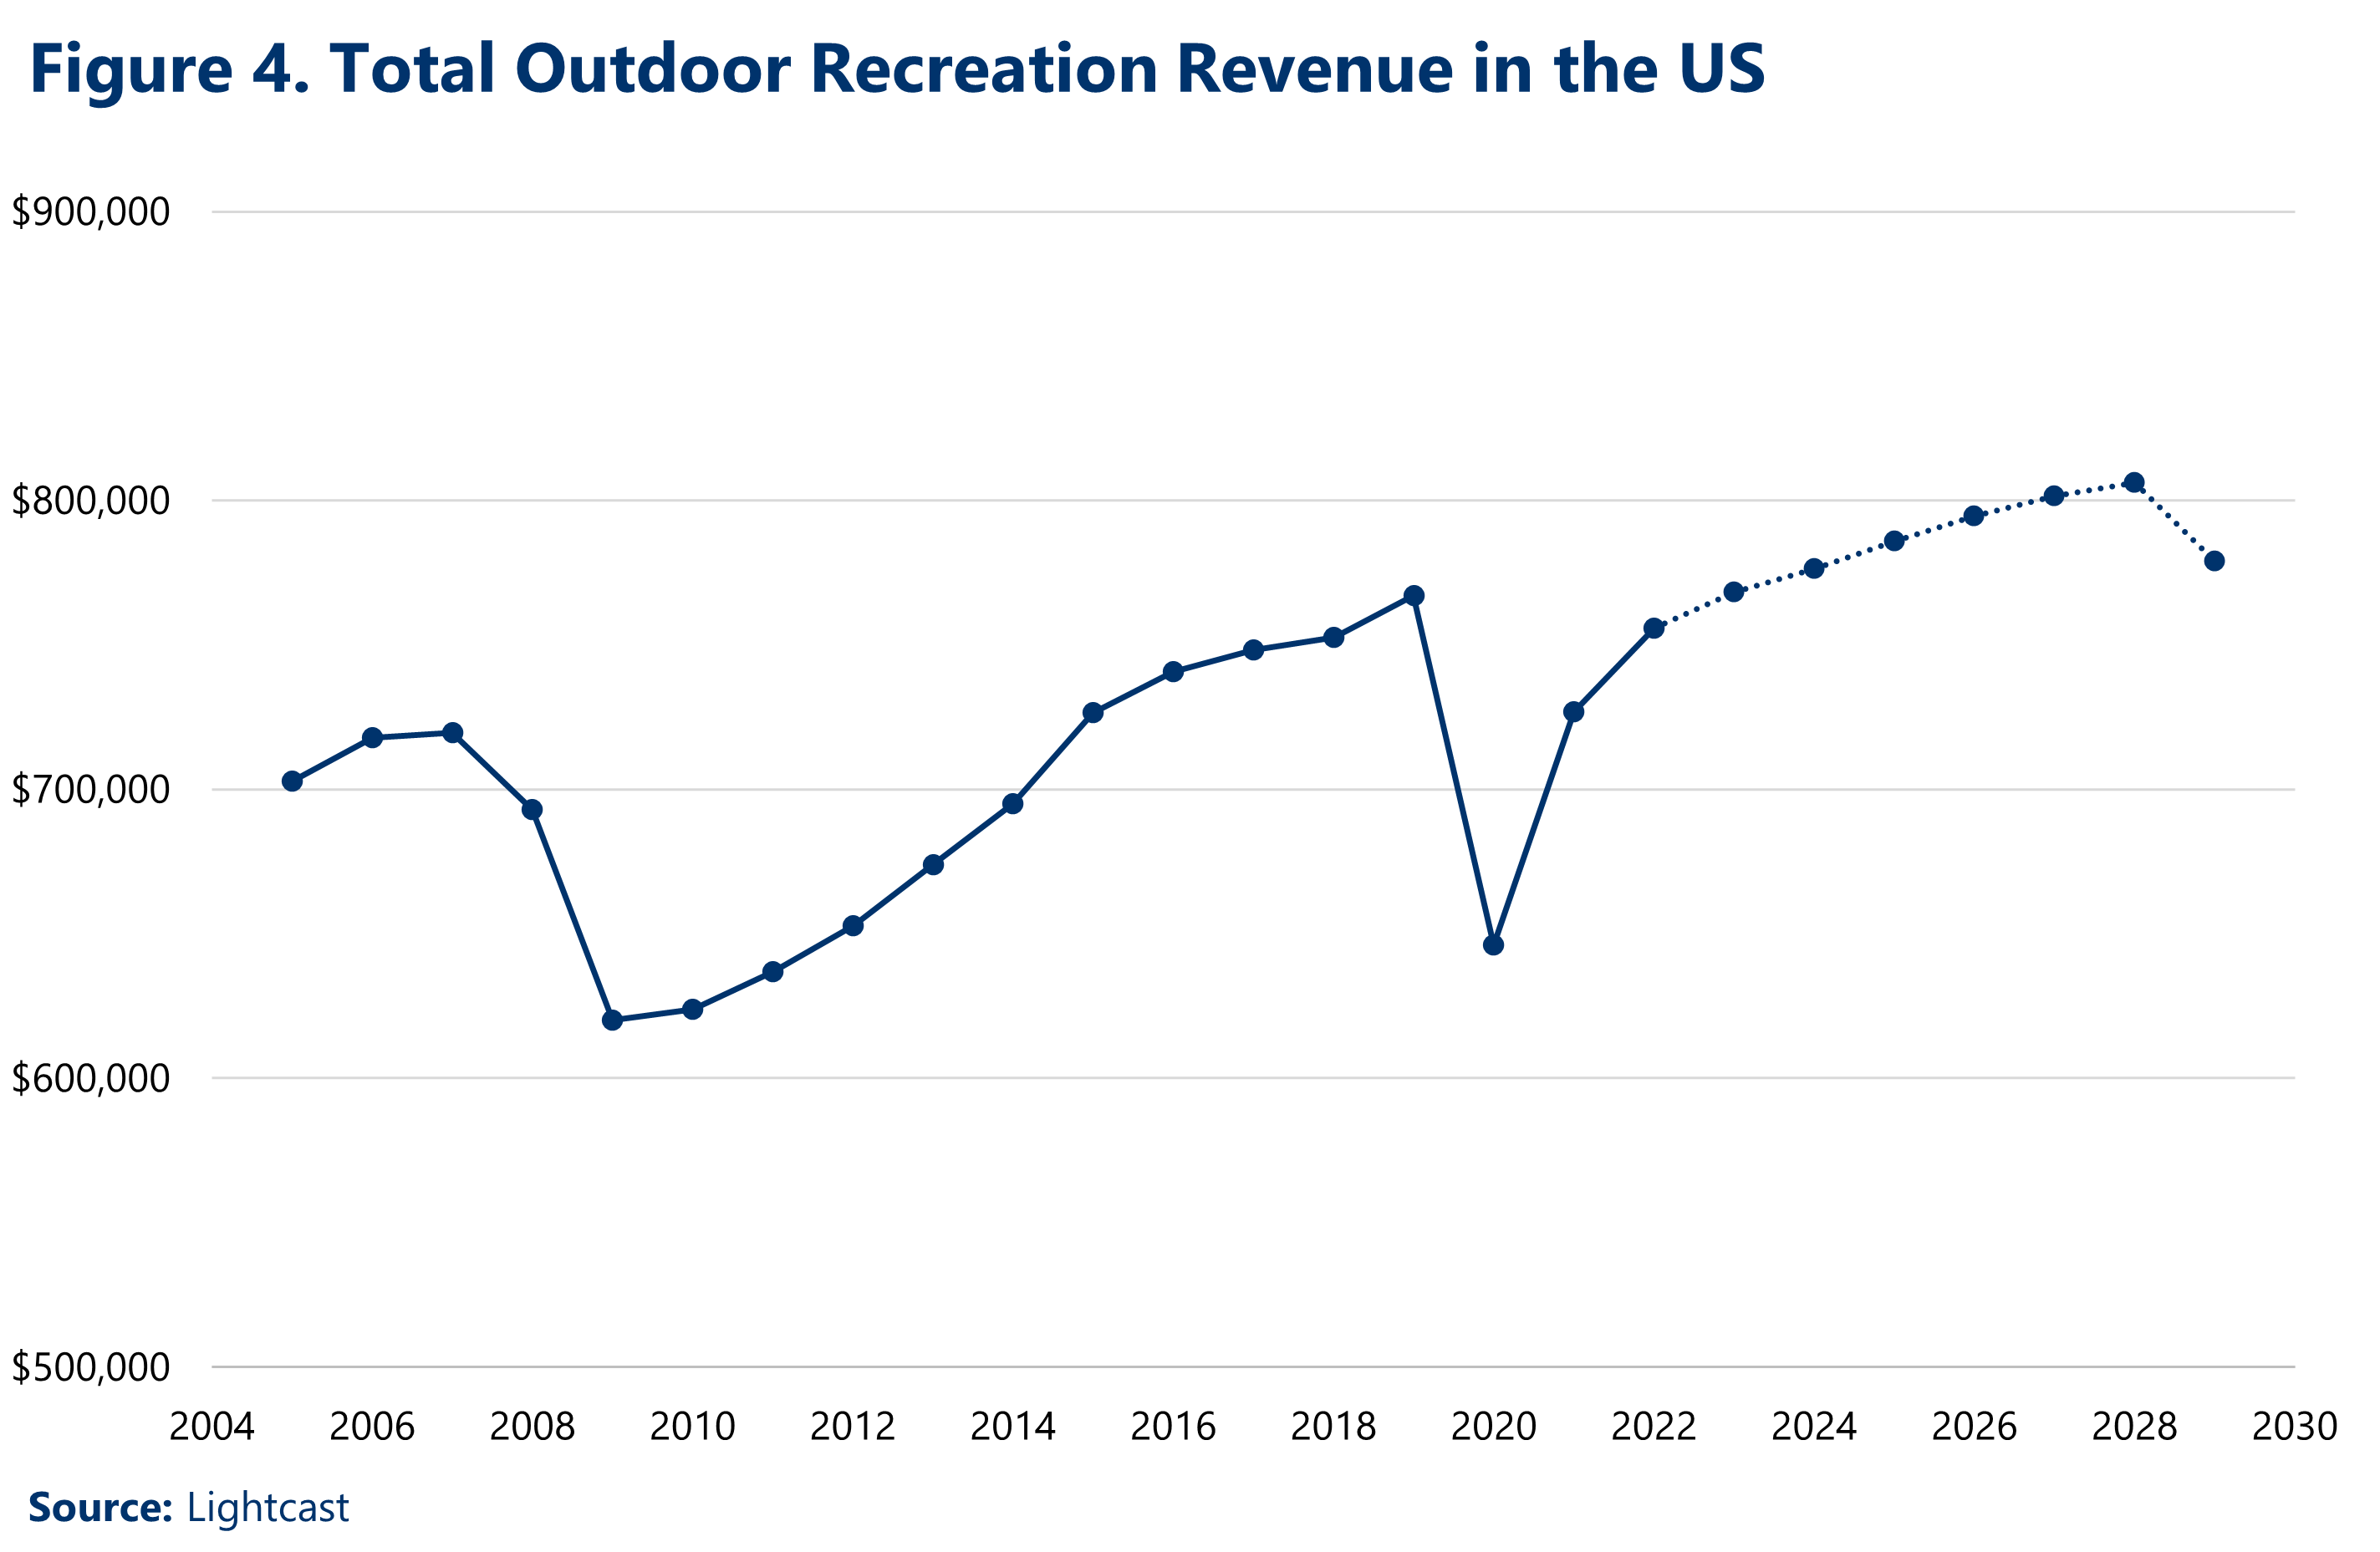
There are four high-level sectors in outdoor recreation economy: manufacturing, wholesale/retail/rental, attractions and activities, and transportation. Transportation and attractions and activities were much more volatile than wholesale/retail/rental and manufacturing during the pandemic.
While all four sectors saw dips in employment from 2019-2020, the greatest impact was on transportation-related jobs, with a 38% decrease. Attractions and activities had a 22% decrease, and manufacturing and wholesale/retail/rental saw 12% and 7% declines, respectively. The inability to travel and participate in activities during the pandemic is clearly reflected in these numbers, as is the lower demand for outdoor recreation equipment, such as boats and bicycles.
Attractions and activities had the largest recovery from 2020-2022 at 20%, followed closely by transportation at 18%. Wholesale/retail/rental and manufacturing have not been as quick to recover, at 11% and 8%, respectively. The pent-up demand for travel and public activities is reflected in this rebound.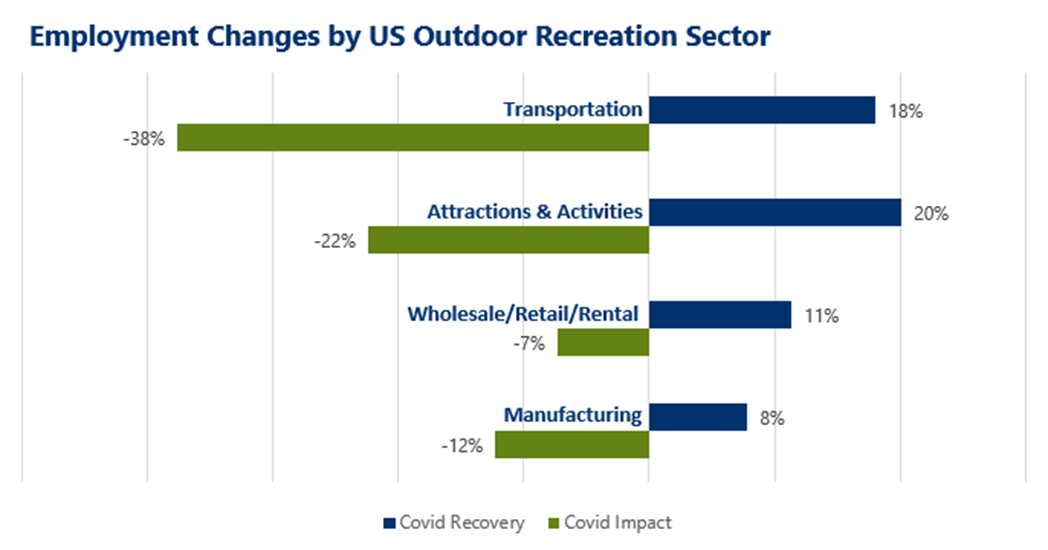
To further examine outdoor recreation, we look closely at three subsectors: athletic and sporting goods manufacturing (NAICS 33992), national parks and other nature institutions (NAICS 71219), and campgrounds and RV parks (NAICS 72121). Information for this section is pulled from IBISWorld, which uses a slightly different classification system than in Table 1.
Although the athletic and sporting goods manufacturing subsector was negatively impacted during the COVID-19 pandemic, revenues quickly rebounded as the economy reopened and people felt comfortable leaving their homes again. Furthermore, as consumers continue to move towards more health-conscious lifestyles as a form of preventative care, demand for athletic equipment will rise.
However, the US is expected to import 55% of its athletic and sporting goods this year, totaling $11.4 billion (Source: IBISWorld). Demand for inexpensive athletic and sporting goods manufactured offshore is expected to grow and presents a challenge that US producers need to be aware of. These imports are dominated by China, which is expected to account for 54.8% of industry imports this year (Source: IBISWorld). This creates an opportunity for increased production and onshoring in the US.
The US is expected to generate $1.7 billion in exports of athletic and sporting goods in 2023, selling 23.7% to Canada and 11.3% to Japan (Source: IBISWorld). Exports have seen steady growth over the past few years, but are still small, relative to imports.
US companies should look for markets globally, as sports participation continues to grow worldwide, and the dollar is expected to weaken. This could benefit manufacturers and grow their international consumer base.
The national parks and other nature institutions subsector excludes state, regional, and local parks, historical sites, botanical gardens, and zoos.
The industry is unique in that it profits only from on-site sales, including admission, concessions, and accommodations (apart from grants and donations). Additionally, operators are reliant on in-person employees.
This combination was lethal for some parks during the COVID-19 pandemic when most people stayed home and international travel was halted. Many operators had no choice but to close their establishments, and not all were able to reopen.
Some parks that have reopened have had to reduce their hours of operation due to profit margin or staffing issues. Many state governments have cut funding for state-funded parks, which are in turn looking for new ways to generate revenue, such as implementing new fees or raising existing ones. Other options include offering new amenities, such as gift shops, upscale cafes, and more.
Things are looking up, however, as schools are once again able to go on field trips and with the rise of eco-tourism and environmental awareness. Revenue is forecasted to grow at an annual rate of 1.3% over the next five years, reaching $1.4 billion by 2028 (Source: IBISWorld).
The number of domestic trips taken by US residents and inbound trips taken by foreign residents in 2023 and beyond is also expected to increase, as is disposable income. This rebound of tourists with pent-up demand for travel and sightseeing, combined with added discretionary income is an opportunity for parks to capture.
The COVID-19 pandemic, while spurring a spike in RV sales, caused a significant decline in the demand for RV parks and campgrounds themselves because of travel restrictions and orders to stay home. However, the pent-up demand for travel is now driving consumers back to campgrounds and RV parks.
A couple of important related factors — demand for RV dealers, number of domestic trips, per capita disposable income, and the number of people over age 50 — are expected to increase in 2023, boosting demand for RV parks and campgrounds. The growth of this industry will be impacted by the trajectory of fuel prices, but revenue is forecasted to rise from $8.7 billion to $9.6 billion in the next five years (Source: IBISWorld).
The demographics visiting RV parks and campgrounds are changing, as remote work allows young people to camp, and operators introduce Wi-Fi to their grounds to accommodate these workers. In 2021, more than half of new campers were millennials (Source: IBISWorld).
As a result, camping and “glamping” are becoming increasingly popular and possible. Hotels provide competition, as the ability to book online is convenient and the amenities are often better. However, parks and campgrounds can offer luxuries such as yurts and swimming areas and provide online booking to help combat these challenges.
An emerging opportunity in this industry is the appearance of camping equipment and RV rentals, which allows for greater flexibility, lower prices and commitment, and the opportunity to try out a different lifestyle. Campground and RV park operators should encourage these rental companies, which could help bring them more business.
Conservation is crucial to success in the outdoor recreation industry. In fact, a 2019 study found that increased land conservation in New England correlated with job growth because of the increase in outdoor recreation jobs. However, protecting lands and waters from development for recreation can be politically divisive as some forms of outdoor recreation can still be quite disruptive to habitats but development is seen as having economic benefits. Therefore, it is important to have a state office dedicated to outdoor recreation which can help with policies and guidelines.
Starting with Utah in 2013, 18 states have created Offices of Outdoor Recreation (ORECs). These offices support economic development, conservation and stewardship projects, youth engagement, and other related initiatives.
Even if your state does not yet have an outdoor recreation office, the US Environmental Protection Agency offers planning assistance through the Recreation Economy for Rural Communities program, helping rural communities leverage their outdoor resources to grow their economies. In 2022, 25 communities were selected for program assistance from Maine to California. The goals of these partnerships include creating trails and green spaces, improving public water access and signage, engaging underrepresented communities, and more.
Funding is also available from the US Economic Development Administration through the Outdoor Recreation Roundtable (ORR), which provides a Rural Economic Development Toolkit as well as implementation grants. The ORR has already designated millions of dollars of funding to rural communities.
Detroit, Michigan, is just one example of the many cities and states working to bring the community back to nature and informs us that outdoor recreation is important and an economic driver in both rural and urban areas.
The Dequindre Cut Greenway in Detroit is a two-mile recreational path in the city that welcomes bicyclists and pedestrians. Opened in May of 2009 through a partnership between the city, Rails to Trails, the GreenWays Initiative, and the Downtown Detroit Partnership, the Cut is now host to an art walk, bicycle rentals, and a yearly event called “Camping on the Cut,” which allows community members to pitch a tent and experience camping, some for the first time. , Sites like the Dequindre Cut introduce people of all ages to outdoor recreation experiences for free and can improve the health of the community and the desirability of the area.
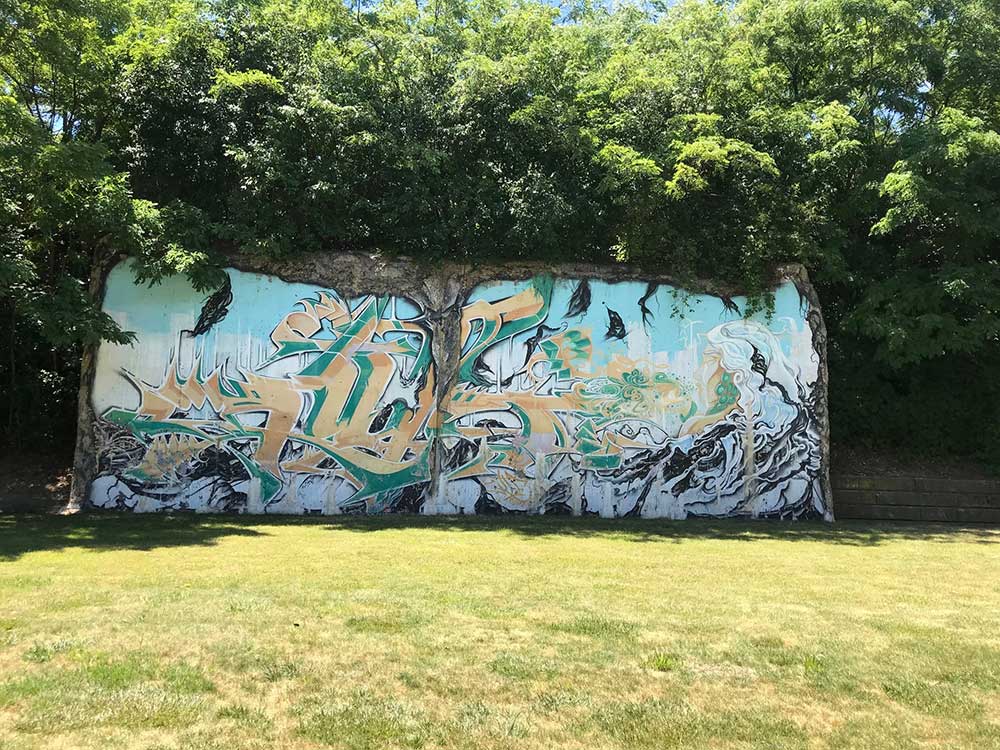
Art at the Dequindre Cut Greenway in Detroit
The outdoor recreation sector is recovering from the COVID-19 pandemic quickly. Employment is expected to reach pre-pandemic levels by 2024, the GRP is still on an upward trajectory, and revenue is already back to pre-pandemic levels.
At the subsector level, challenges include high rates of imported athletic equipment, low profit margins for national parks, and competition for luxury camping space.
Potential solutions include expanding the athletic equipment customer base worldwide as the dollar loses value, changing the fee structure when offering new amenities at national parks, and providing more luxurious outdoor spaces and amenities, as well as online booking, for campers and RV owners.
To support outdoor recreation growth and economic growth, economic developers should:
These opportunities can help to further grow the outdoor recreation industry, which is not only good for our economy but good for our community health.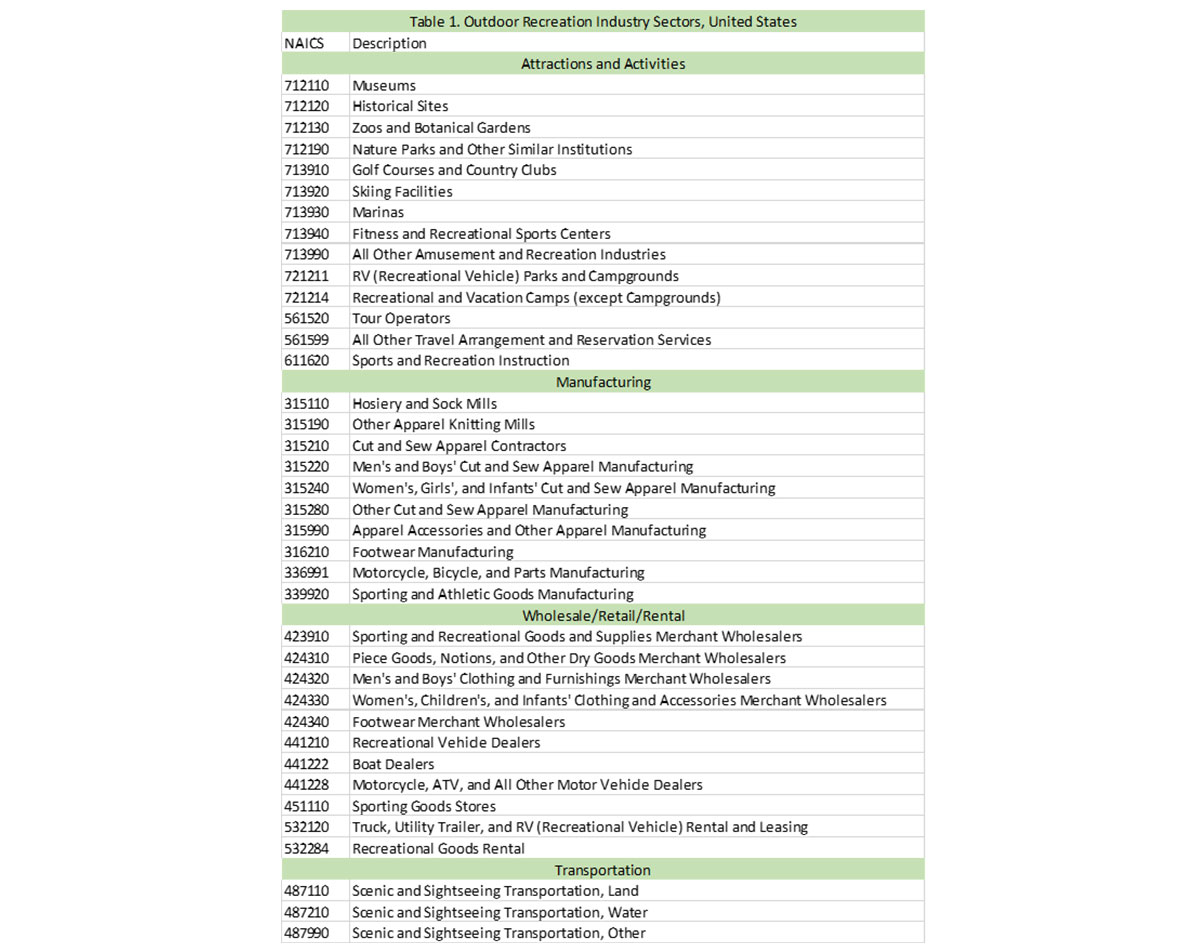
Learn about our Industry Analytics and Strategy Services

Economic and Fiscal Impact Analysis
A recent analysis of a digital equity program in Westchester County, NY, revealed that it generated outsized economic benefits and return on investment for the community.

Business Retention and Expansion (BRE)
Industry Analytics and Strategy
Your resource for understanding today and looking toward tomorrow