
- Navigator
- Industry Analytics and Strategy
- Prospecting and Business Attraction
Foreign direct investment (FDI) is a critical indicator of a region’s economic vitality and global competitiveness.
For economic development organizations (EDOs) of all sizes, understanding where international capital is flowing and what is driving that movement is essential for:
Tracking FDI data allows EDOs to identify their region’s role in the global economy and uncover opportunities to attract investment in strategic sectors. It can also help with business retention and expansion programs by revealing growing trends or specific needs of foreign companies.
At Camoin Associates, we help economic development leaders uncover and interpret FDI data relevant to their geography and goals. We have worked with states, regions, and cities to analyze global investment trends, among other economic indicators, to inform industry strategy and site readiness efforts.
This trends report provides a high-level snapshot of FDI investment trends in the US from October through December 2025. Highlights include:
If you want to translate labor market and investment data into actionable insights to help your community stand out in an increasingly competitive field, Camoin Associates can help. Contact our Director of Industry and Workforce, Alex Tranmer, CEcD, to learn more at alexandra@camoinassociates.com. 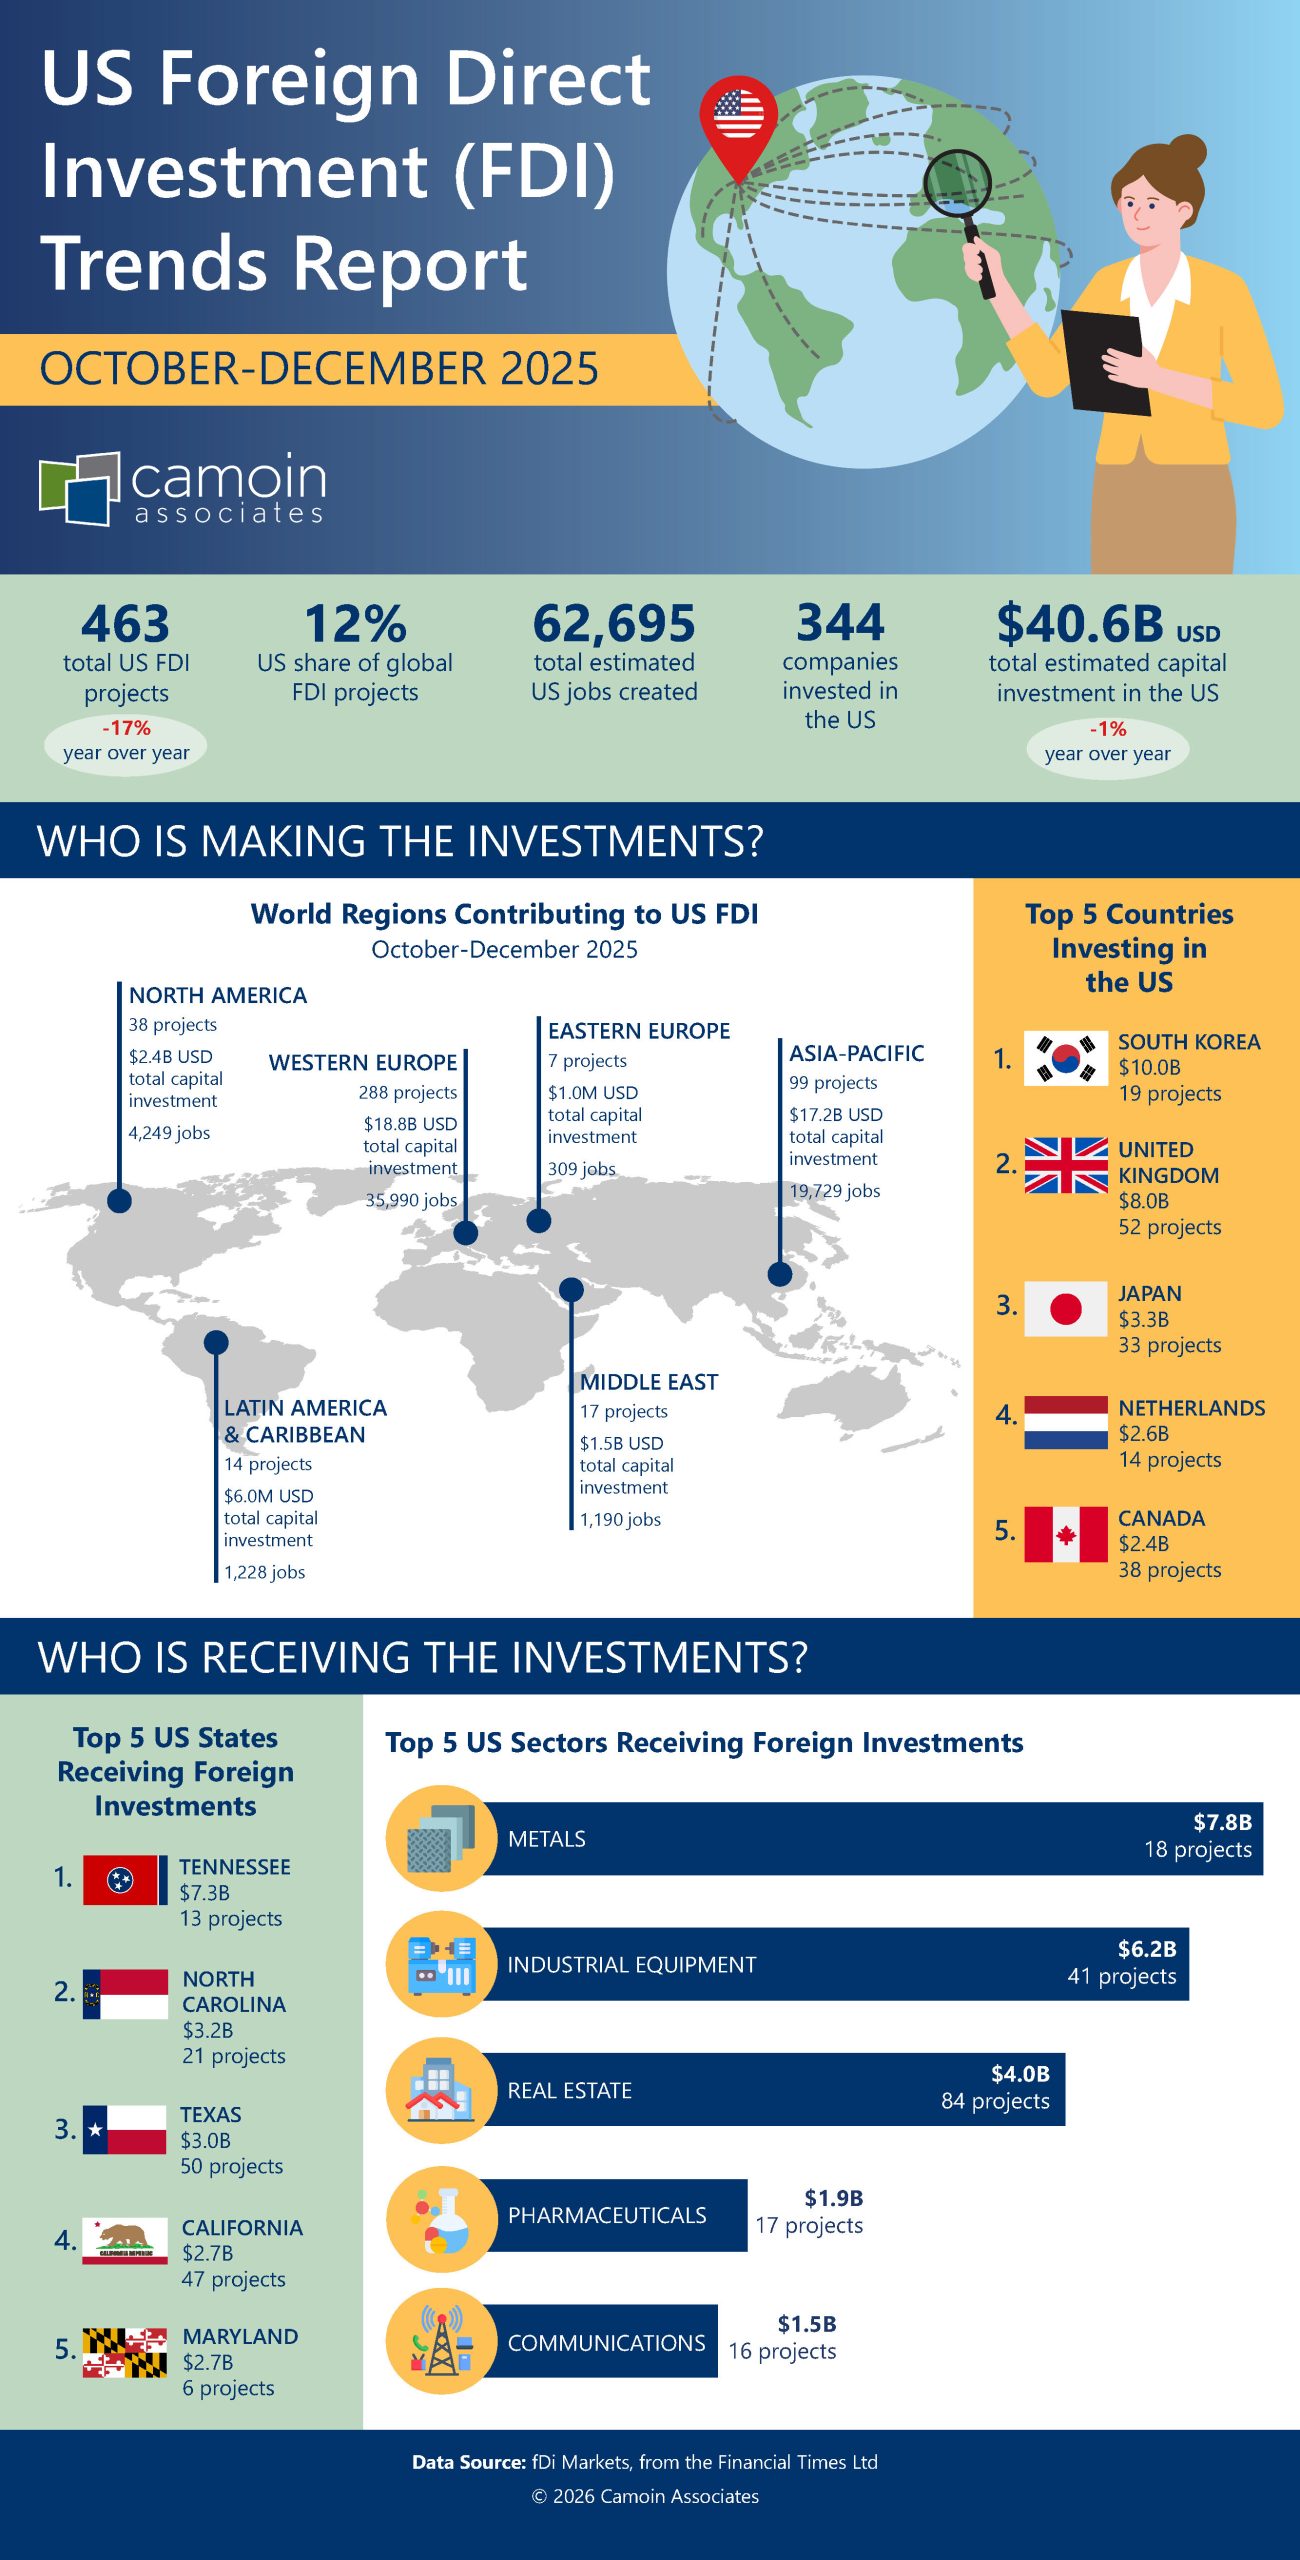
Previous US FDI Trend Reports:
June-September 2025 Trends Report (1.3 MB PDF)
📍 Related Articles:

Real Estate Development and Housing
In 2025, the City of Albany, NY, partnered with Camoin Associates to complete a citywide housing audit that offers lessons for other mid-sized, moderate-growth cities about how to align housing policy with local economic realities while advancing equitable outcomes.

Industry Analytics and Strategy

Entrepreneurship and Innovation
Your resource for understanding today and looking toward tomorrow