
- Navigator
- Expansion Solutions
- Industry Analytics and Strategy
- National
- Transportation and Warehousing
 This article originally appeared in the February 2026 edition of Expansion Solutions Magazine.
Logistics refers to the process of moving inputs and outputs within our economy. It is a complex interplay of industries, infrastructure, workers, and knowledge that support all our economic activity, including not only manufacturing, wholesale, and retail goods, but also all other sectors that rely on obtaining supplies for the production of goods and services and the movement of their products and services to customers (see Figure 1).
In this article, we examine economic performance, recent investment, and emerging trends in logistics and provide takeaways for supporting business expansion in the US. We take a broad view of logistics, encompassing industries within transportation, warehousing, and supply chain logistics, which we refer to as TWL.
Figure 1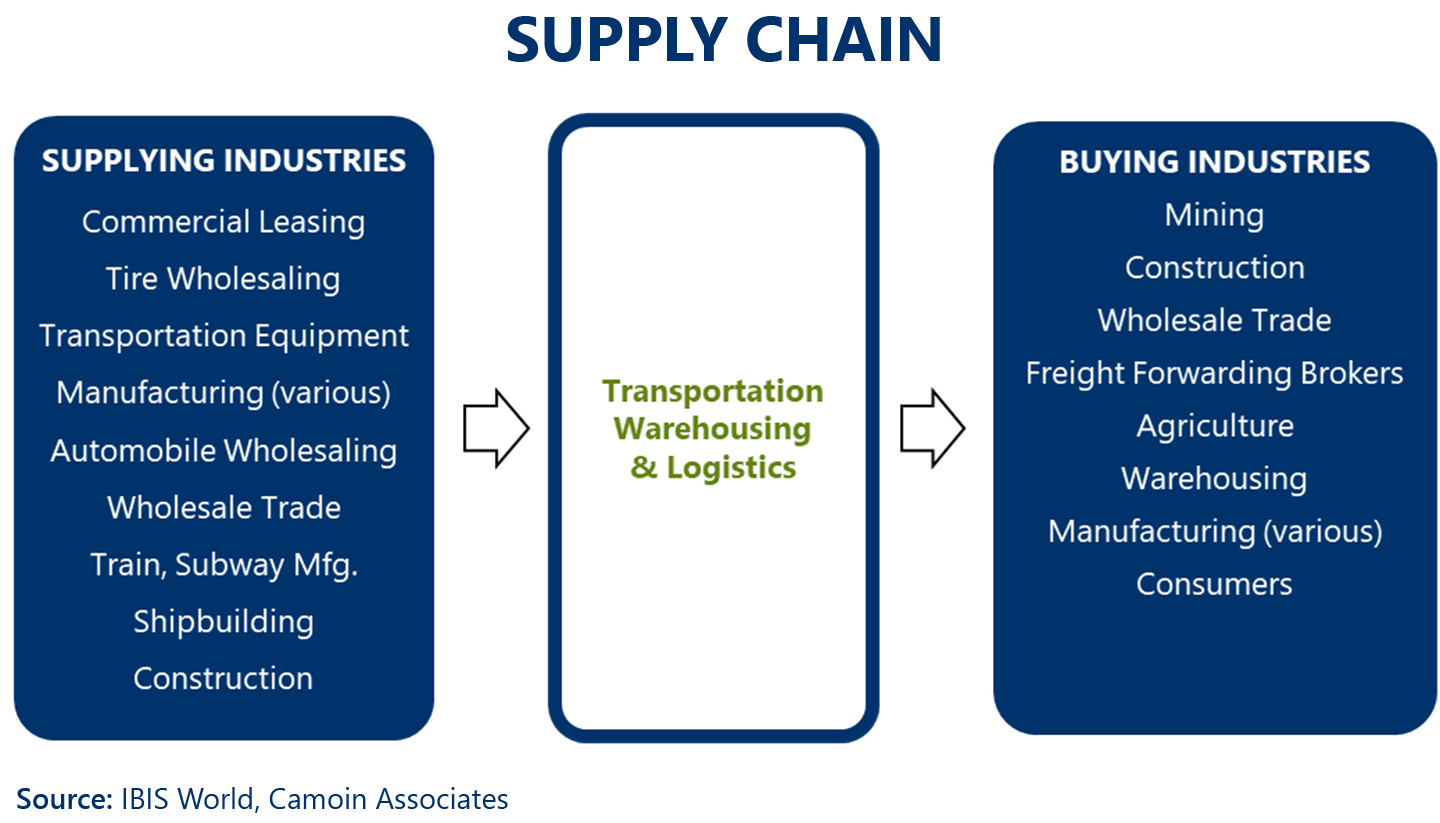
The industry data for this article is associated with:
These NAICS comprise activities that span the entire transportation, warehousing, and logistics ecosystem, including:
In 2024, TWL industries employed 6.6 million workers across the country within 319,944 establishments and contributed more than $900 billion to the US Gross Domestic Product.
Historically, between 2001 and 2007, the industries experienced modest growth followed by a decline in 2008 related to the Great Recession (see Figure 2). Recovery was slow but gained momentum in 2013 and continued through 2019, when COVID-19 led to a decline as production and related supply chains were significantly constrained.
Recovery from COVID-19 occurred from 2022 through 2024. Lightcast projects that growth in TWL employment will continue through 2034, but at a lower rate than the recent post-COVID-19 years.
The projected slow growth is based on multiple factors, including the impact of US tariffs, slowing global economic growth, and reduced hiring needs due to technology and automation.
Figure 2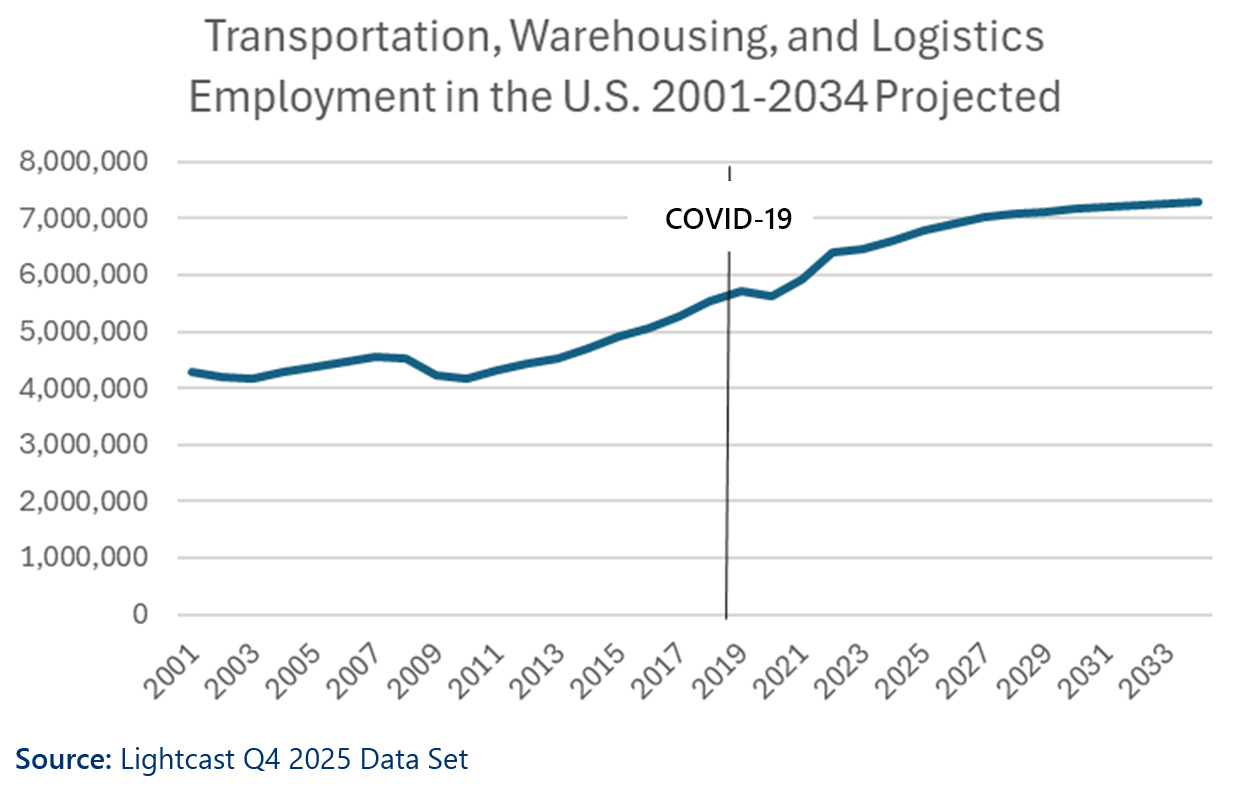
Between 2000 and 2024, total employment in the TWL industry grew by 17.3%, outpacing the overall economy’s 10.1% growth (see Figure 3).
Figure 3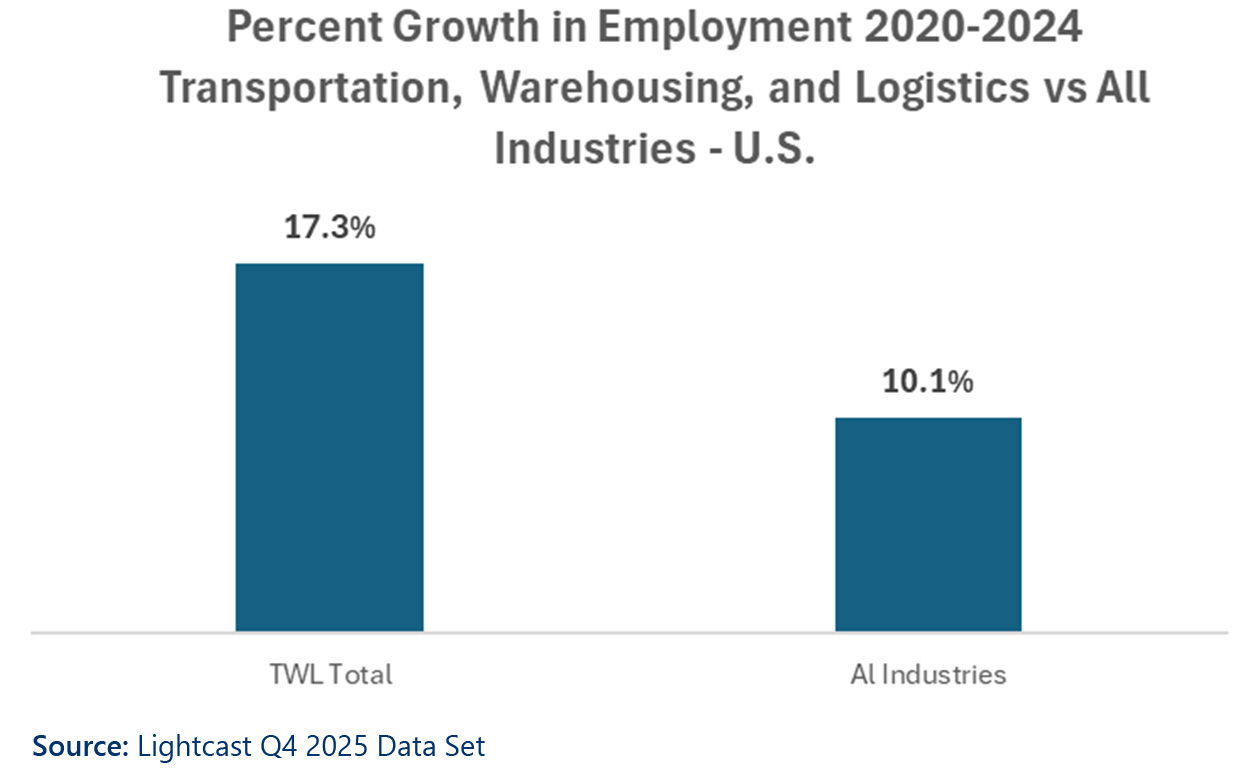
Across the country, Virginia, Tennessee, and Indiana have the highest concentrations of TWL employment, followed by Alabama, South Carolina, and Delaware (see Figure 4).
Figure 4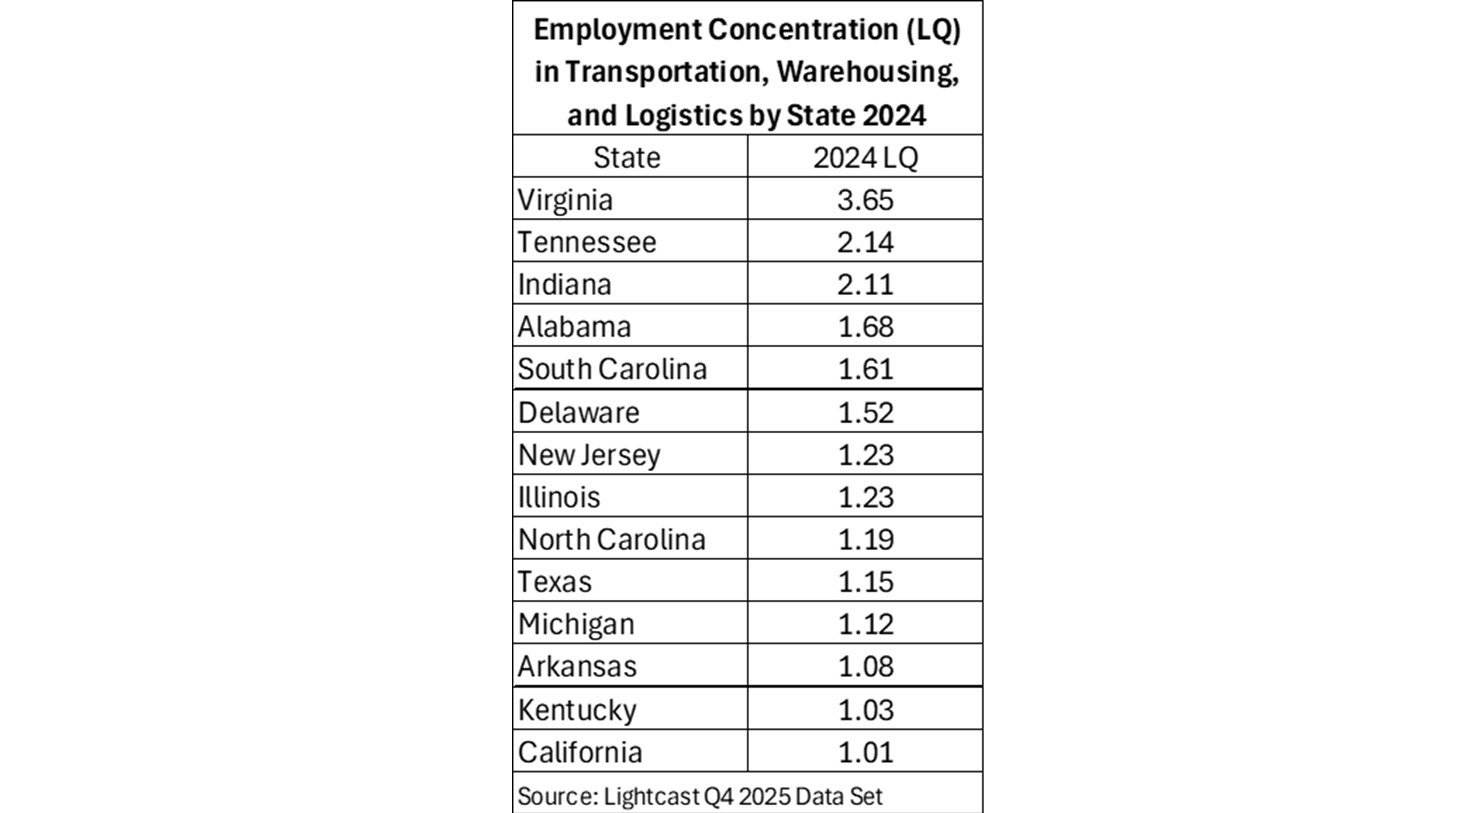
Within TWL, General Warehousing and Storage is the largest industry sector, employing 1.8 million people in the US as of 2024, which reflects 31% growth since 2020.
The next-largest subsector, General Freight Trucking, Long-Distance, Truckload, employs 667,000 workers in 2024, up 2.5% over the same period.
As TWL becomes increasingly reliant on data, analytics, modeling, and AI, the Process, Physical Distribution, and Logistics Consulting Services subsector is also expanding. In 2024, it employed 179,000 workers, reflecting 21% growth since 2020 (see Figure 5).
Figure 5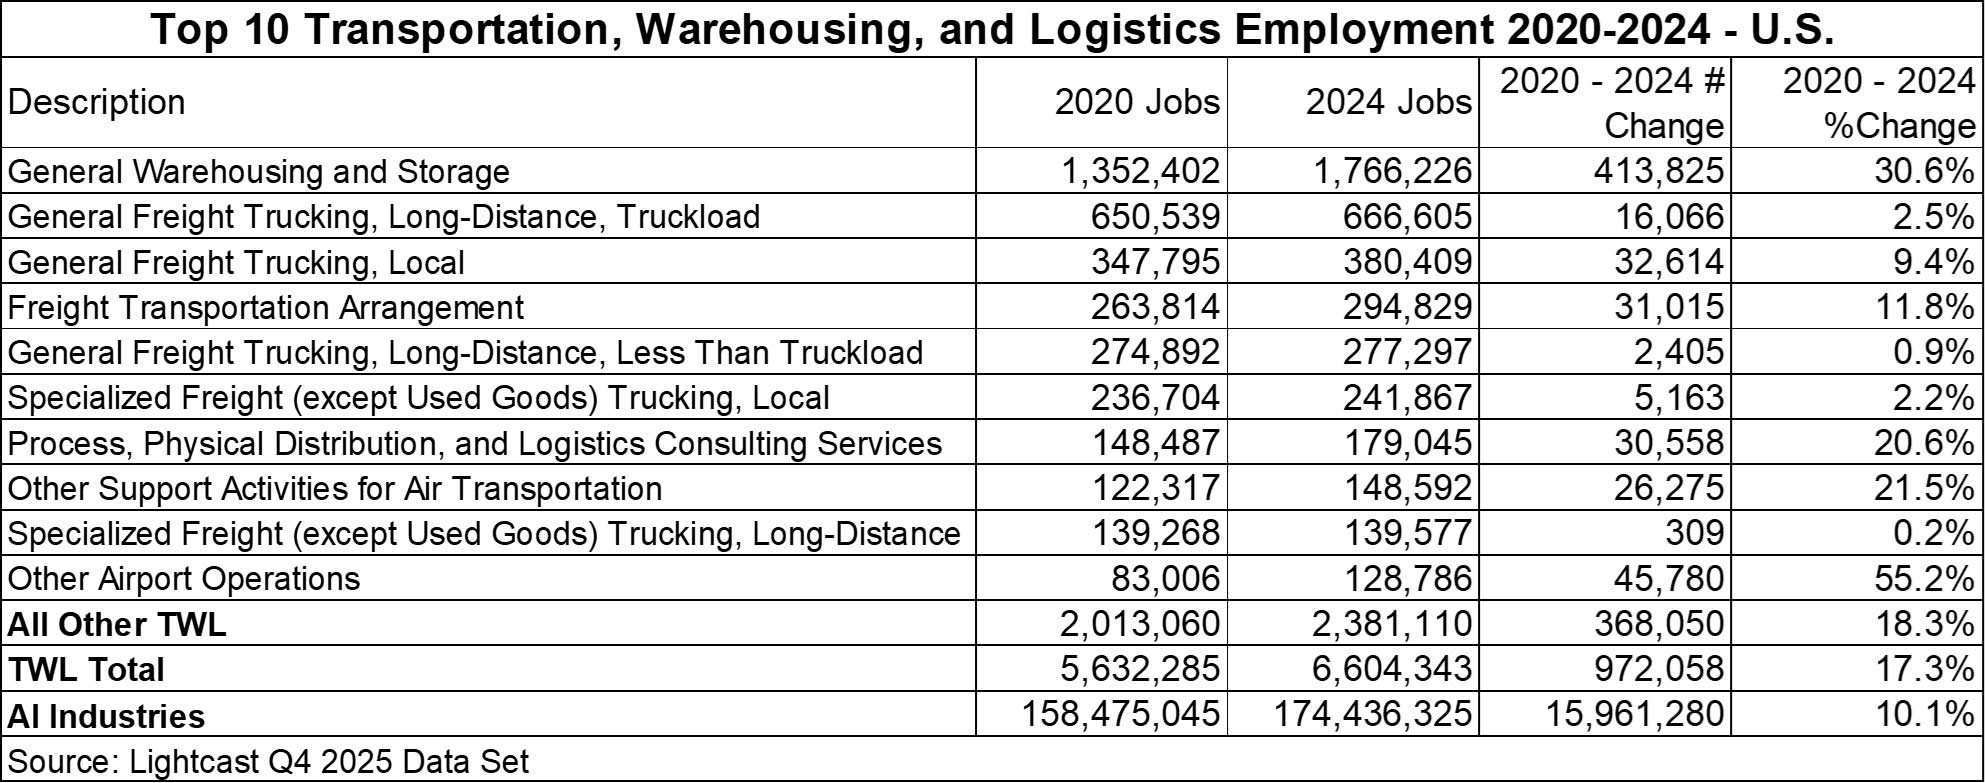
Workforce pressures continue to challenge the TWL sector, as persistent hiring difficulties and increasing retirements are prompting employers to raise wages.
Heavy and Tractor-Trailer Truck Drivers remain the dominant occupation, employing 1.3 million workers in 2024, about 20% of all TWL jobs (see Figure 6). This segment is particularly affected by an aging workforce, with retirements outpacing the number of new entrants willing or prepared to take on roles characterized by long hours and extended time away from home.
While automation and autonomous vehicle technologies may eventually ease these pressures, widespread adoption remains years away.
Across the broader TWL workforce, many roles remain accessible through on-the-job training and industry certifications. However, as data and analytics play a larger role in TWL operations, demand for higher-skilled positions, such as management analysts, software developers, and logisticians, has accelerated. Together, these occupations currently account for about 96,000 jobs, after adding 38,000 since 2020, and typically require at least a bachelor’s degree (see Figure 6).
Figure 6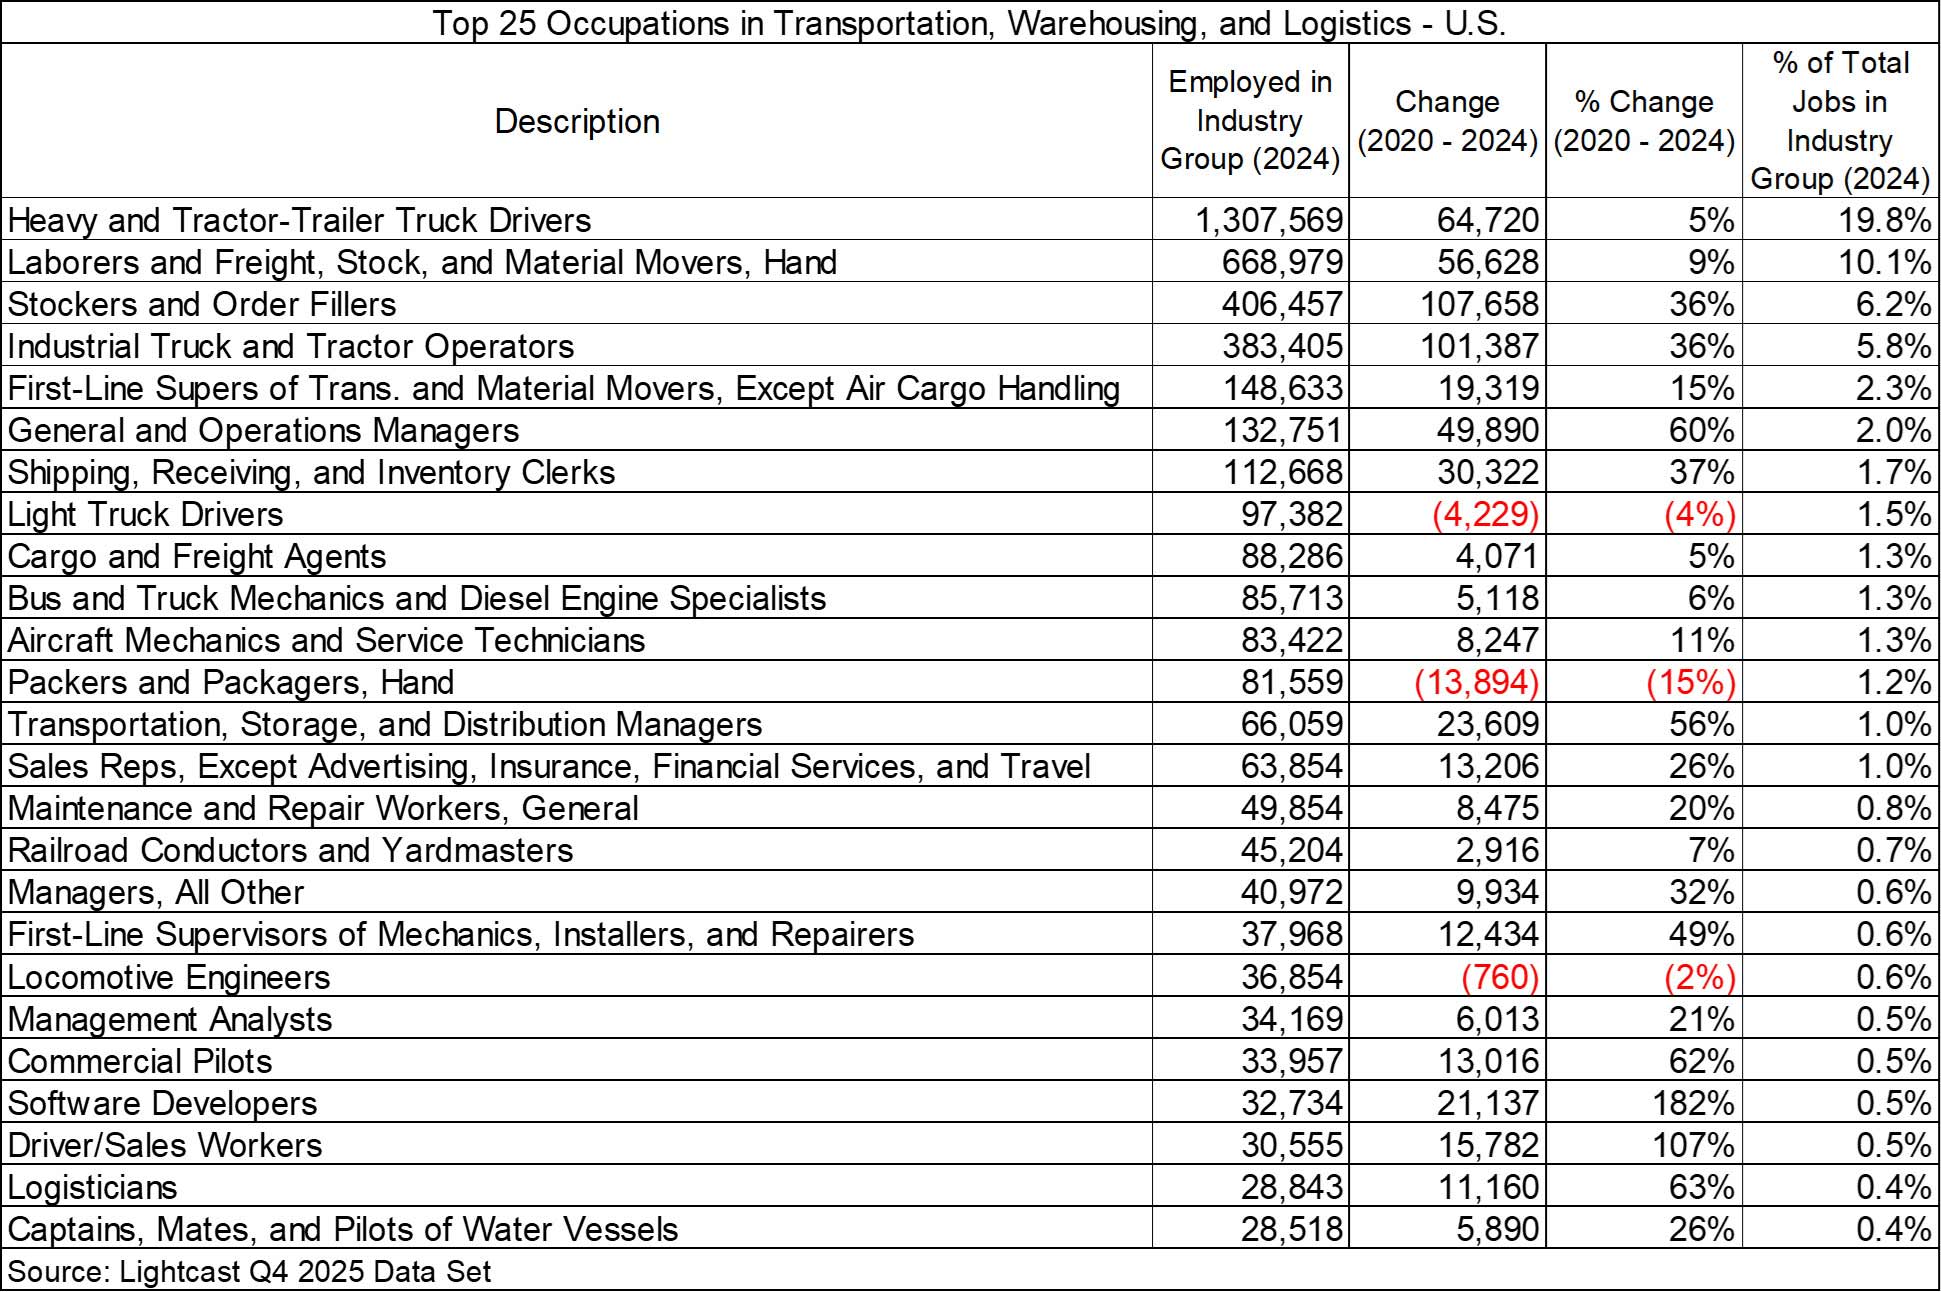
The TWL sector is being reshaped by a convergence of forces, including advances in technology, shifting geopolitical dynamics, rising service expectations, and an urgent need for stronger, more resilient supply chains.
Supply chain transparency has emerged as one of the most influential trends. Companies are looking beyond their immediate suppliers to better understand where the greatest risks and dependencies lie along national and global supply chains.[1] Geopolitical tensions and extreme weather events have underscored the fragility of global networks, prompting executives to reassess every link in the chain and invest in greater contingency planning.
This demand for visibility is increasingly enabled by the Internet of Things (IoT), where sensors provide real-time tracking of goods and allow for predictive modeling that can identify route interruptions before they occur.[2]
As consumer demand for near-immediate delivery intensifies, the rapid growth of warehousing and advancements in real-time tracking are enabling faster fulfillment across a wider range of communities, including suburban and rural markets. These expectations have led to increased investment and innovation in “last mile” delivery and overall supply chain efficiency.
According to a 2025 survey by Autostore, 34% of warehouses plan to make order tracking a central performance metric over the next year. This trend points to a broad technological shift, as companies seek to enhance efficiency, strengthen customer relationships, and remain competitive through greater transparency.[3]
Applications of artificial intelligence (AI) and automation also continue to reshape warehousing and logistics operations. AI-powered tools are improving inventory management, demand forecasting, and product sourcing decisions.
This is creating opportunities for venture funding to enable growth. In April 2025, 1Logtech Inc., based in Westerville, OH, closed a $1.5 million seed funding round to accelerate the growth of its AI-powered iPaaS (integration platform as a service).[4]
Robotics and “cobots” are now standard in many distribution centers, and adoption is expected to grow significantly as labor markets tighten and customer expectations for delivery speed rise.
This is leading to new investment in the US, including foreign direct investment. In September 2025, TVS Supply Chain Solutions, an India-based multinational company that pioneered the development of the supply chain solutions market in India, inaugurated a 225,000-square-foot facility in Waterloo, IA, featuring state-of-the-art, highly automated robotics to support local manufacturing.[5]
With the investments and funding for substantial technology come a seemingly endless range of analytics to help diagnose and identify operational issues. Predictive maintenance, supported by real-time data analytics, is also essential.
As digital tools become more integral, cybersecurity has become a top priority to safeguard sensitive operational systems and protect the gains achieved through technology integration.[6]
All of these shifts also have major implications for the workforce. With an aging labor pool and rapidly changing skill requirements, companies must invest in training and upskilling to ensure employees can effectively collaborate with advanced technologies. The roles within logistics look markedly different today than they did a decade ago, and workforce capacity will increasingly determine a company’s ability to grow.[7]
The industry is also being shaped by broader sustainability pressures. Electrification of fleets, adoption of alternative fuels, and investments in cleaner technologies are accelerating, not only because of regulatory or environmental commitments but because they can improve long-term performance and cost efficiency.
In the case of electric vehicles, the availability of charging infrastructure remains a significant limitation to building out entire fleets. Without strategically located charging stations, trucks are forced to deviate from their routes, adding time and cost that counteract the efficiencies electrification is meant to deliver.[8]
Even so, major players are setting the pace for an industry that will redefine operational excellence in the year ahead. Examples include Maersk, which is targeting net-zero GHG emissions by 2040,[9] and DHL, which is targeting net-zero by 2050, supported by sustainable aviation fuels and electric vehicles.[10]
In addition to technological advancement, TWL industries are being impacted by US and global trade relations and policies. Regarding the US warehousing and storage market, IBIS World reports:
“Elevated tariffs introduced by the US in 2025 are prompting industry-wide concerns about the rising costs of imported goods and long-term demand from key retail markets. In reaction, companies are actively seeking ways to mitigate financial strain, most notably by reorganizing warehouse operations for cost savings. This trend points toward a shifting supply chain landscape, where a multi-node network of warehouses becomes essential to accommodate goods arriving from a broader array of suppliers and to keep products flowing to market efficiently.”
—IBISWorld, “General Warehousing and Storage in the US Industry Data and Analysis,” March 2026
Real estate demand within the TWL sector is increasingly shaped by evolving retail strategies and the ongoing impacts of tariffs. As companies confront unexpected and frequent supply-chain disruptions, many are adopting leaner inventory models and diversifying sourcing, which in turn is driving the need for multi-node distribution networks and more space-efficient warehouse facilities.
A recent investment by DP World, a global logistics and supply chain leader headquartered in Dubai, illustrates this trend toward flexible, automated space. In August 2025, the company expanded its Central Pennsylvania footprint with a new 249,600-square-foot, multi-customer warehouse in Middletown designed for maximum flexibility and scalability, particularly for small and mid-sized clients.
An announcement published by DP World in August 2025 states, “The warehouse will support business-to-business, direct-to-consumer, and eCommerce distribution models, offering cost-effective third-party logistics (3PL) services without the burden of dedicated infrastructure.”
With an understanding and continued monitoring for trends and projections in TWL, economic and business developers will be able to find investment and expansion opportunities in their regions. Key support by economic developers includes:
Learn about our industry and workforce analytics and strategy services
📍 Related Article: How to Assess Your Transportation, Logistics, and Distribution Networks for Economic and Business Growth
Jim Damicis is Senior Vice President at Camoin Associates. He has more than 30 years of experience using research and analysis to help professionals, communities, regions, states, and public and private organizations prepare for an emerging economic future. He has led a variety of projects at Camoin Associates, including local and regional economic development strategies, targeted industry analysis, workforce development, innovation economy, and evaluation and benchmarking. Jim is the former President of the Northeast Economic Development Association (NEDA) and has served in leadership capacities for more than 10 years with NEDA. He serves on the Federal Reserve of Boston’s New England Public Policy Advisory Committee, and is an instructor for the International Economic Development Council’s (IEDC) annual strategic planning course. Jim is also a collaborator with Communities of the Future, focusing on economic transformation. He holds a Master of Public Policy and Administration degree from the Edmund S. Muskie School of Public Service at the University of Southern Maine and a Bachelor of Arts degree in Economics and Political Science from the University of Connecticut, Storrs..
Alexandra Tranmer, CEcD, is the Director of Industry and Workforce at Camoin Associates. As a senior project manager, Alex has led complex strategic planning efforts in geographies ranging from bustling urban centers to pastoral tourist destinations, requiring adept stakeholder management and collaboration. She works with clients to balance the competing interests of stakeholders while ultimately helping them develop an ambitious yet achievable plan under their current organizational climate. Alex has an Honors Bachelor of Arts degree and a Master of Science degree in Planning (MScPl) from the University of Toronto in Ontario, Canada.
Endnotes:
[1] A.P. Moller – Maersk, “The Logistics Trend Map,” 2025, https://image.e.maersk.com/lib/fe4111727164047c771470/m/1/Maersk_Trend-Map-2025.pdf
[2] A.P. Moller – Maersk, “The Logistics Trend Map,” 2025, https://image.e.maersk.com/lib/fe4111727164047c771470/m/1/Maersk_Trend-Map-2025.pdf
[3] Lee, Seth, “General Warehousing and Storage in the US Industry Data and Analysis,” IBISWorld, March 2026, https://www.ibisworld.com/united-states/industry/general-warehousing-storage/1224/
[4] 1Logtech news release, “1Logtech Closes $1.5M Seed Round to Accelerate AI-Driven, No-Code Integration Platform for Transportation,” April 8, 2025, https://www.accessnewswire.com/newsroom/en/transportation/1logtech-closes-1.5m-seed-round-to-accelerate-ai-driven-no-code-integration-platform-1011846
[5] TVS SCS North America news release, “TVS SCS North America Grows at 20% CAGR; Aims to Achieve $500 Million in Revenue,” September 30, 2025, https://www.tvsscs.com/tvs-scs-north-america-grows-at-20-cagr-aims-to-achieve-500-million-in-revenue/
[6] Association for Supply Chain Management, “Top 10 Supply Chain Trends, 2025”, December 13, 2024, https://www.ascm.org/making-an-impact/research/top-10-supply-chain-trends-in-2025/
[7] Association for Supply Chain Management, “Top 10 Supply Chain Trends, 2025”, December 13, 2024, https://www.ascm.org/making-an-impact/research/top-10-supply-chain-trends-in-2025/
[8] Firth, Emma, “The Shift to Electric Fleet Vehicles in Logistics,” Maersk, June 4, 2025, https://www.maersk.com/insights/sustainability/2025/06/04/transitioning-to-electric-vehicles-in-logistics
[9] Maersk, “All the Way to Zero,” viewed in January 2026, https://www.maersk.com/sustainability/all-the-way-to-net-zero
[10] DHL Group, “Environment: We Want to Be the Green Logistics of Choice,” viewed in January 2026, https://group.dhl.com/en/sustainability/environment.html

Industry Analytics and Strategy
We examine the economic performance, recent investment, emerging trends, and expansion opportunities in transportation, warehousing, and supply chain logistics.
Industry Analytics and Strategy

Real Estate Development and Housing
Your resource for understanding today and looking toward tomorrow