
- Navigator
- Industry Analytics and Strategy
- Prospecting and Business Attraction
 International companies invested over $133 billion in nearly 2,000 capital investment projects in the United States last year, pouring money into local economies nationwide. Almost 80% of these projects represented new investments, while about 20% represented expansions or co-locations.
Inflation and rising geopolitical tensions threatened the global economy in 2023. However, while total foreign direct investment (FDI) into the US economy fell by around 22% year over year, the total number of investment projects remained relatively constant.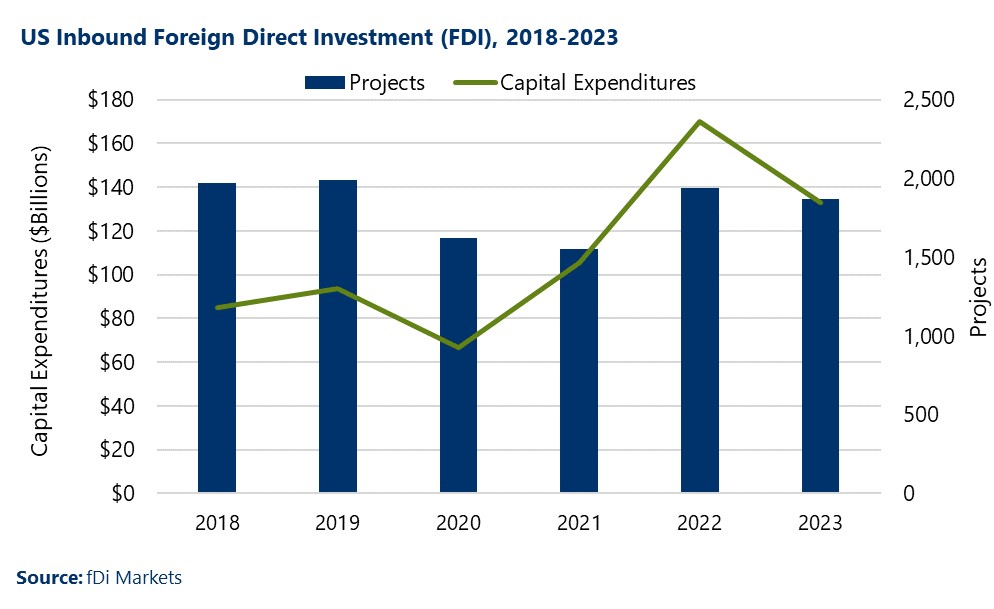
FDI came from 68 countries in 2023, but a handful stand out as the most prominent sources. The top five countries alone — the United Kingdom, Switzerland, Germany, Canada, and Japan — account for 51% of all projects announced in 2023. However, when you look at dollars invested, South Korea was by far the biggest source of FDI last year, with companies investing over $21.3 billion into the US economy.
Significant investments made by South Korean companies in 2023 were focused on battery manufacturing for electric vehicles (EVs), including the following:
Given these major investments in the battery/EV sector, it is no surprise that renewable energy and environmental technology projects received the greatest total investments in 2023. Overall, investments in the Environmental Technologies cluster accounted for around $45.5 billion of inbound FDI into the US in 2023, a third of the total investment by dollar value.
The top five subsectors by total capital expenditures are all directly connected to renewable energy:
These top five subsectors made up 42% of the total value of international investments last year, over $55.3 billion.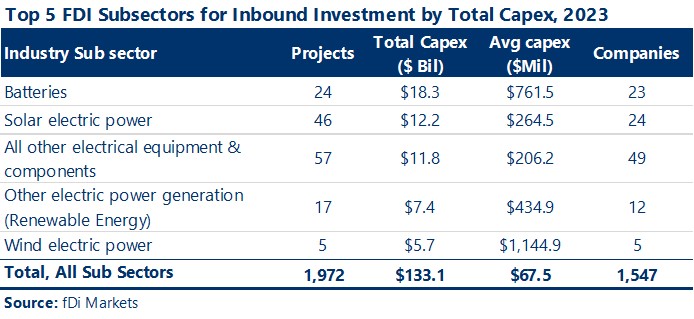
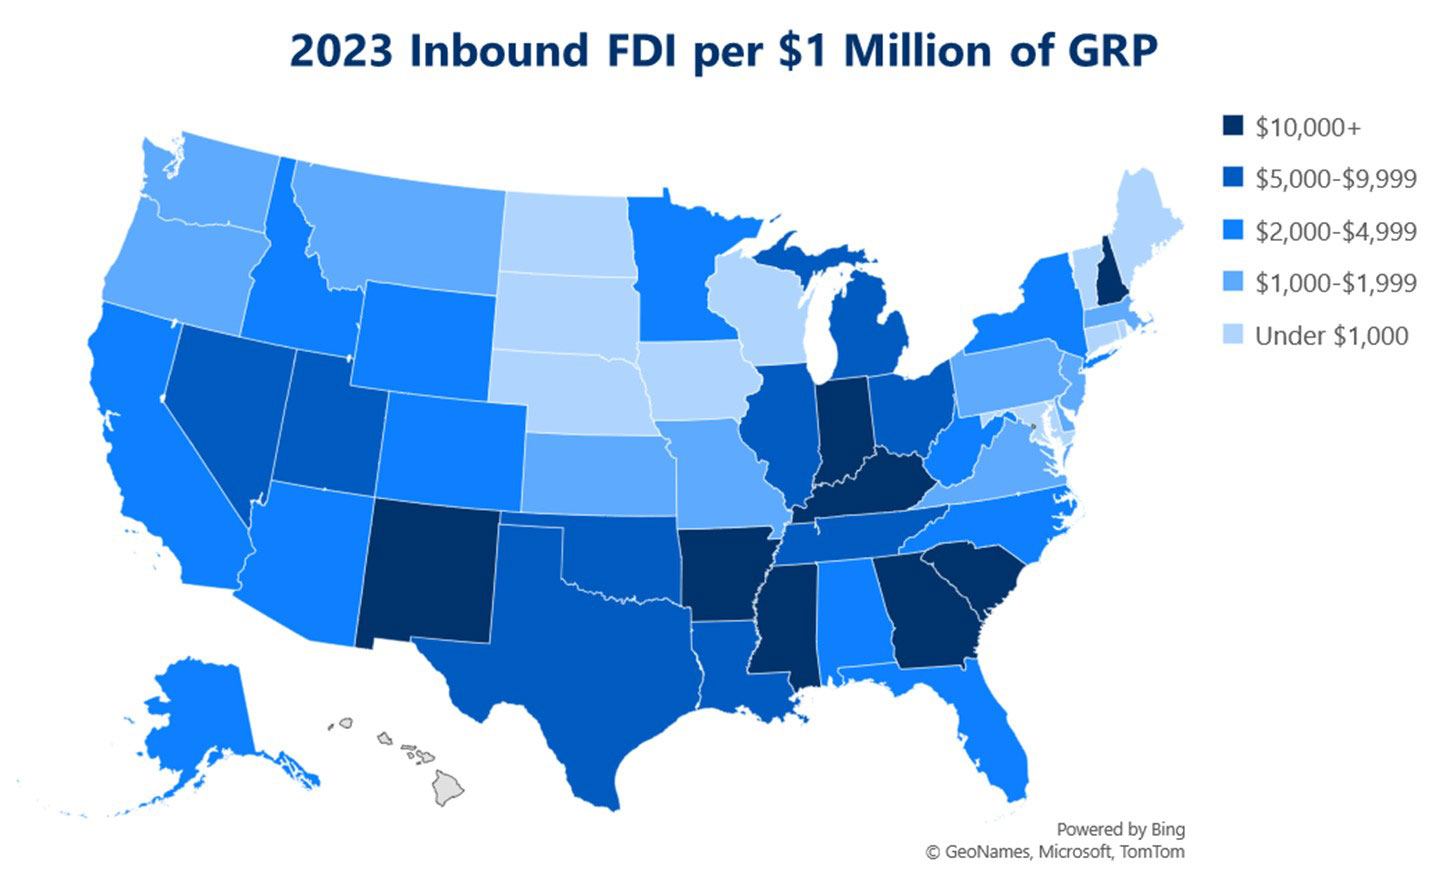
Southern and midwestern states drew significant volumes of FDI last year. Overall, Texas attracted the most foreign investment in 2023, with over $20.5 billion of capital expenditures (capex) across 237 projects. When you adjust for Gross Regional Product (GRP), New Mexico, South Carolina, and Indiana attract the most FDI.
The following are examples of major foreign investments in the United States in 2023, not including the South Korean investments already listed above:
The latest data is clear: Interest by foreign companies in investing in new or expanded sites in the US remains very strong. This presents an excellent opportunity for economic development organizations seeking new business investment and jobs in their regions to get on these companies’ radars.
Business attraction and marketing efforts can target specific countries and industries and highlight the unique assets and benefits your region offers, such as available land, ease of permitting, business friendly permitting processes, access to a skilled workforce, proximity to major transportation and shipping hubs, and quality of life.
Are you interested in developing an international business investment strategy targeting particular industries? Or are you ready to develop and execute an FDI-focused business attraction and lead generation plan for your community? Camoin Associates can help.
Learn more about our Target Industry Analytics and Strategy services
Learn more about our Prospecting and Business Attraction services
📍 Related Article:

Real Estate Development and Housing
Housing is essential infrastructure in rural communities, small towns, and micropolitan areas. It shapes workforce stability, economic resilience, and long‑term community viability. Explore case studies, actionable tools, and a step-by-step guide for meeting housing needs in these unique markets.
Industry Analytics and Strategy

Prospecting and Business Attraction
Your resource for understanding today and looking toward tomorrow